TechChange courses are designed for busy young professionals. Today we are very excited to chat with Grace Kim, the project manager for the Global Innovation Exchange, who participated in TC103: Technology for Disaster Response. She discusses her experience with the overall program, and how it has impacted her work.

Q: Why did you decide to enroll in the Tech for Disaster Response course?

I spent 8-years as a software sales executive at IBM and several startups, but I had always wanted to focus on T4D. My initial plan was to try T4D from the private sector side, but soon realized that most companies have not integrated products and services serving the development industry into their core business. This makes it difficult to find a full-time, dedicated role focusing on T4D in the private sector. In May 2015, I decided it’s time to change careers, but felt I needed to brush up on development technology. I have always been interested in disaster response and humanitarian aid, but never really figured out how to break into that sector. So I searched online for courses, TC103 came up…and the rest is history!

Q: How did the Technology for Disaster Response course impact your professional life and/or professional development?

While I was taking TC103 in June 2015, I was spending more time and effort (by choice!) on the course than on my day job. It made me realize that life is too short to spend my life doing something that I was not passionate about so I LEFT MY JOB! During my “funempoyment”, I did 60 informational interviews in DC between August and November (Chris Neu, COO of TechChange, was #38 and Nick Martin, CEO of TechChange, was #51) and landed my job at USAID by the end of December. TC103 helped me to learn very quickly about the technologies available in disaster response and develop a network of practitioners in this space. Being able to name drop relevant organizations and people during my informational interviews and job interviews allowed me to demonstrate that I wasn’t a complete foreigner coming from the private sector.

Q: What caught your attention about TechChange courses, or got you interested in taking them?

First, TechChange offered a course that was of personal interest to me – technology for disaster response.  Second, it was affordable for me to pay out of pocket. Third, the platform was really easy to use, and encouraged participation and collaboration between students so I truly felt that I got to develop some good relationships with other classmates.  Fourth, the instructor, Timo Leuge, was very knowledgeable and brought experts in the field as guest lecturers, which I thought, were really great.

Q: What would be an advice to other participants taking a TechChange course? How can they get the most out of it?

1. Do all the reading because you will learn a lot from them.  2. Participate in the course and earn points (for your certificate) by commenting and jumping in on various discussion strings.  You will feel more connected to your classmates. 3. Visit the TechChange office in DC…they are super friendly!

Q: How have you been able to use what you learned in the courses in your work, and how has the program overall been helpful to you?

The Global Innovation Exchange covers all sectors in development so I’m using the learnings from TC103 to make sure that we have the disaster response/humanitarian aid sector content developed in terms of innovations, funding opportunities, resources and events relevant to this sector.

Q: What is the Global Innovation Exchange?

The Global Innovation Exchange is an online platform that is a “one stop shop” for development innovations, funding opportunities, resources and events.  It is free to create an account to connect with like-minded individuals and experts, browse content by sector/topic/region, and share your expertise for the benefit of the global development community.  The goal is to democratize and provide equitable access to information, reduce duplication, and allow us all to make informed business decisions across the development industry.  It’s a great tool to see what people are working on and where, and search for funding opportunities, resources and events that is relevant to you.

Q: Are you new to the ICT4D sector? 

Yes, although I’ve kept a pulse on T4D even when I was in the private sector, joining the Global Development Lab is my first job in the T4D sector.

Q: Would you recommend TechChange courses to a friend?

100%!!!  It is great to see TechChange evolving to offer new courses like the diploma course in M&E and white labeling courses for organizations.  What’s truly beneficial is that the instructors are practitioners who bring real-life experience to the course along with their network of experts who guest lecture.
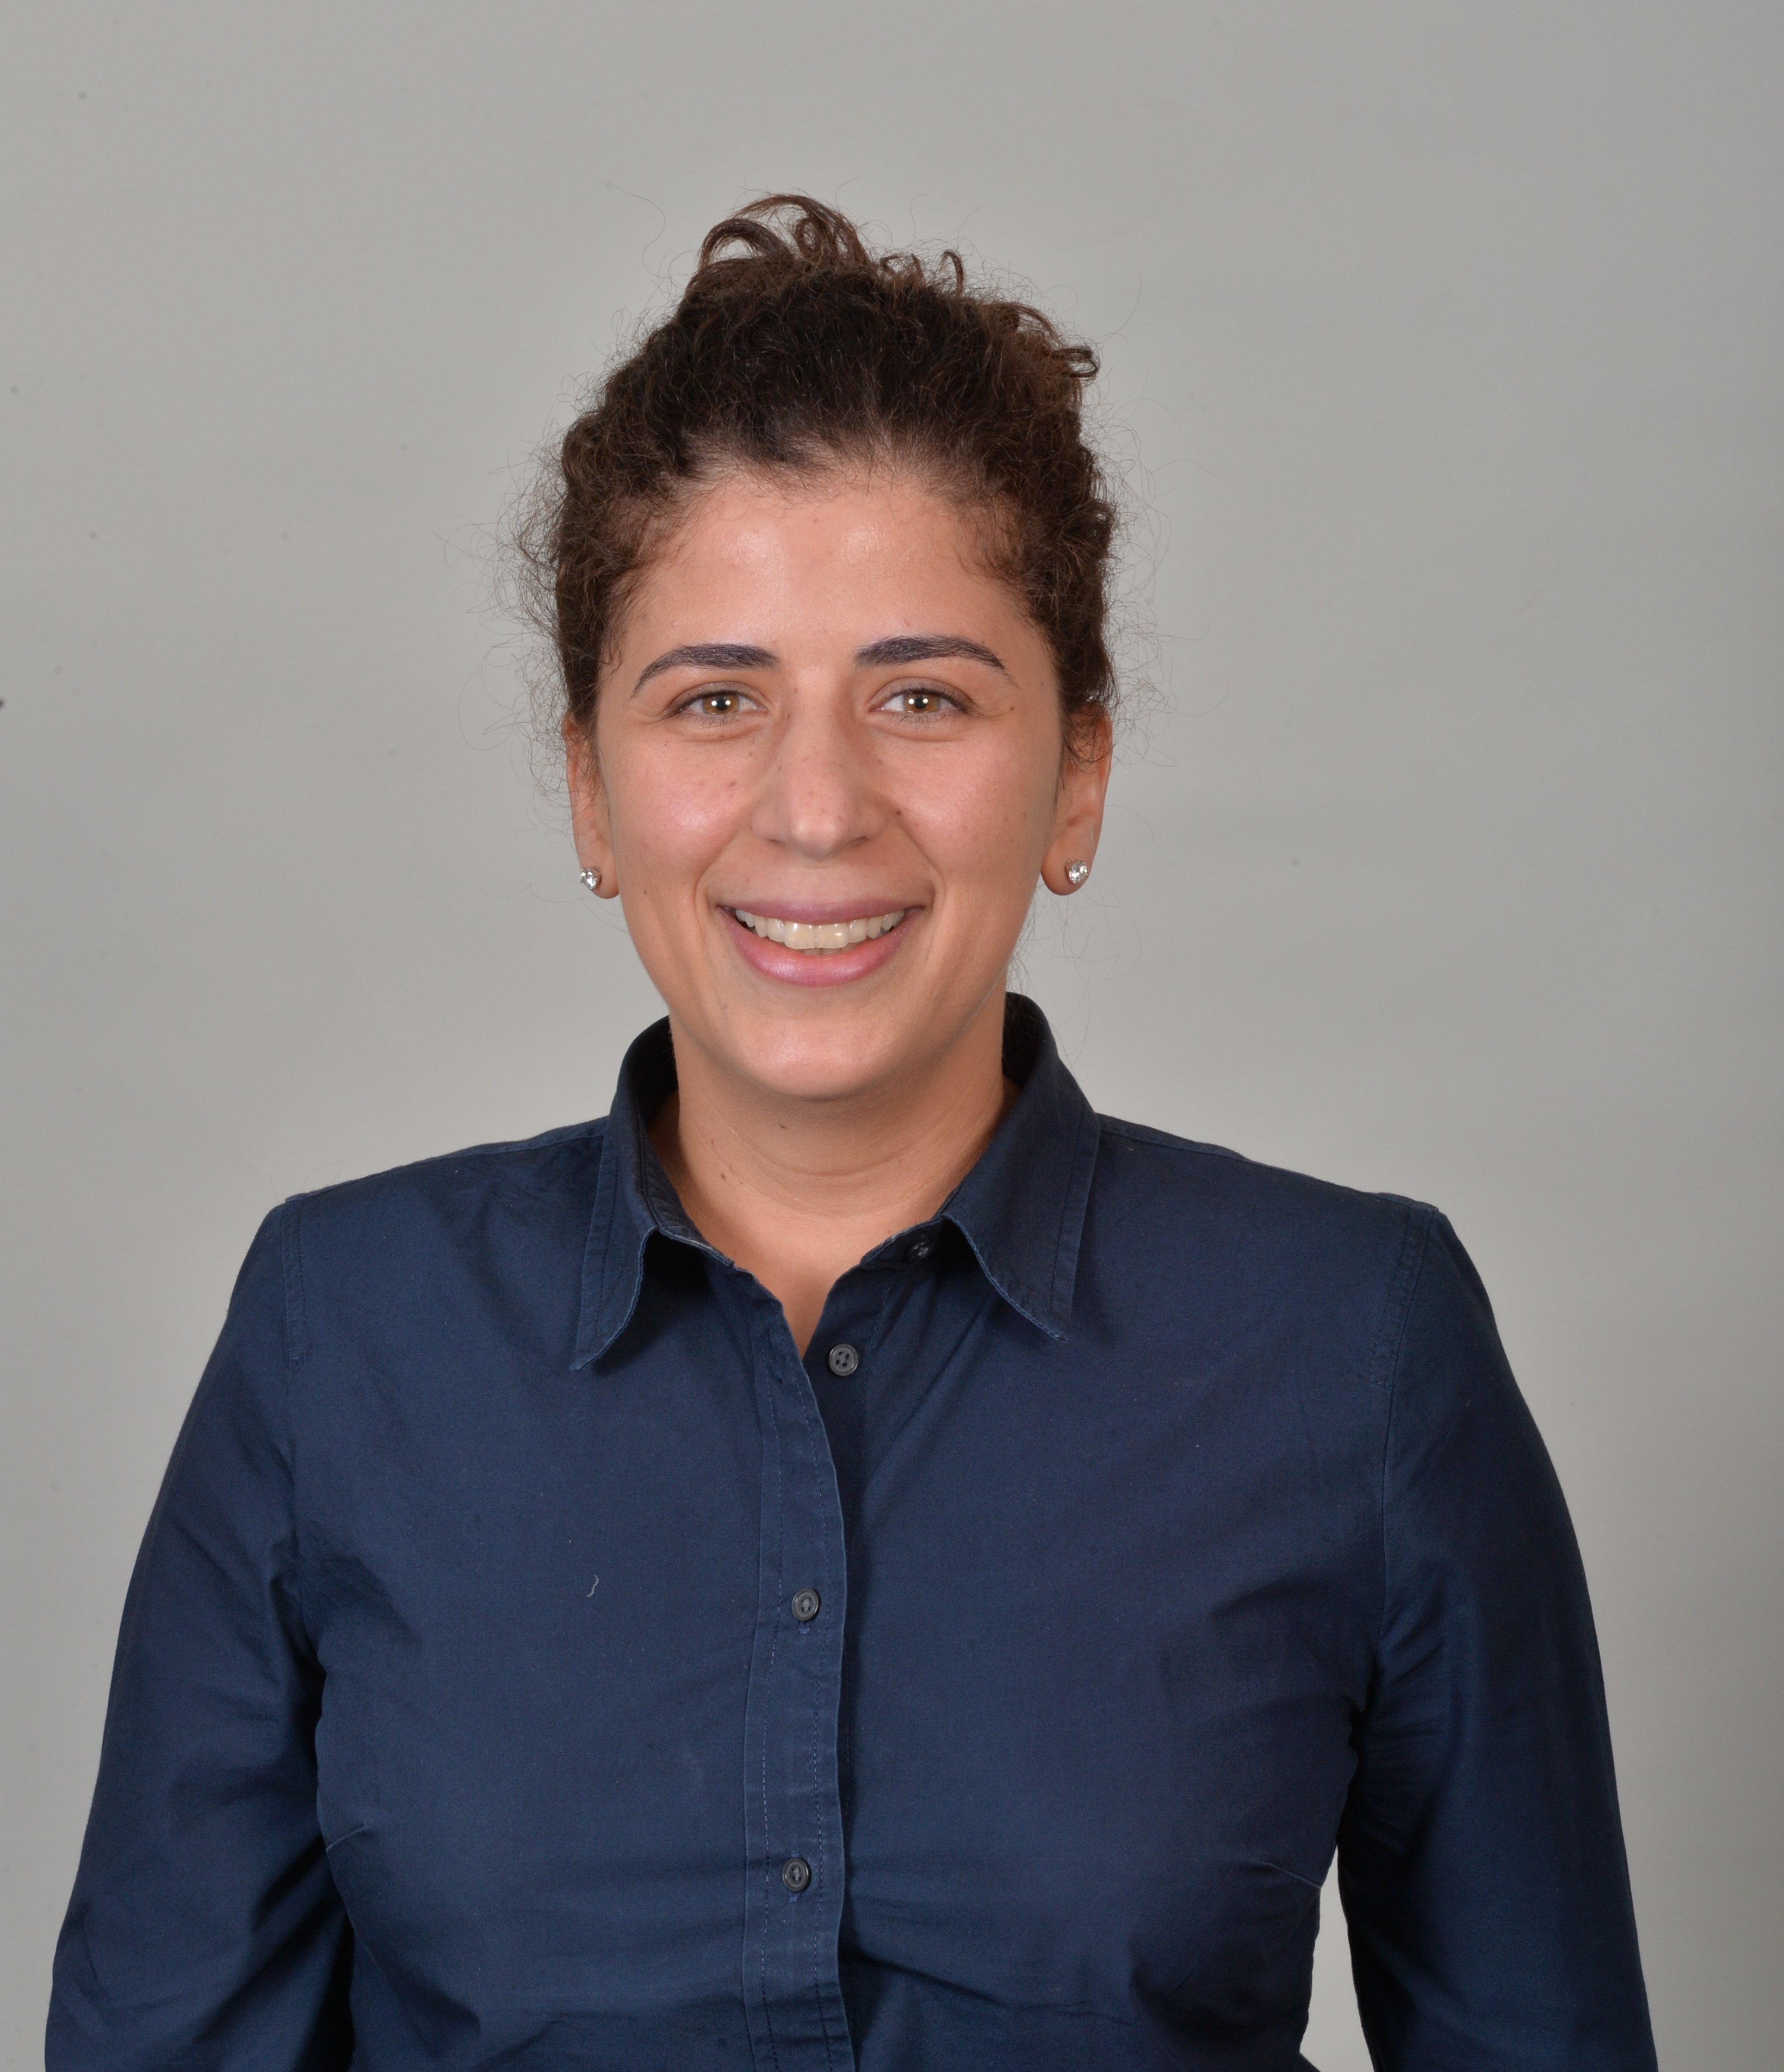
About Grace:

Grace Kim is a Korean-American returned Peace Corps Volunteer from Los Angeles. She spent over 15 years in the private sector in environmental consulting, digital development and enterprise software.  And recently, she joined USAID | Global Development Lab as the project manager for the Global Innovation Exchange.grace-kim-headshot


We consume and produce data at ever growing rates, aiming to better understand the past, observe the now, and to be better prepared for the future. However, data can only fulfill its purpose when we can make sense of it, generate insights, and put it into action. The process of turning data into insights requires many steps, and doing it effectively involves many strategies.

Step 1: Visualization

One of these key steps is visualization, which is the visual organization of data using various shapes, sizes, colors, and layouts. Visualization creates data charts such as bar graphs, line graphs, scatterplots, and even maps and networks. This step helps us make sense of large volumes of abstract information, without much effort. Effectively using the visual language for data provides a natural, intuitive way to see and understand features and trends in data.

Step 2: Interaction

Another key step is interaction. When you ask questions, focus on certain properties, or change the visual representations, you are engaging in an interactive dialogue with your data. The vast computing capabilities in our digital devices allow us to dynamically filter across categories, resort items, pan map views, retrieve details, and explore alternatives. Together, visualization and interaction with data lets you find the answers you are looking for, and answer the questions that you didn’t know you had!

Step 3: Putting It All Together

How can you start your data dialogue? There are many tools to help you collect, transform, and visualize data in many different forms. However, with so many options, choosing the best approach based on your needs, your data, and your experience level is not trivial. You may start visualizing your data with tools that offer a graphical interface. This allows you to import a dataset and construct data charts by selecting chart types or mapping data attributes to various visual elements and components (shapes, colors, layouts, x-axis, etc.). Existing graphical charting tools still require training to make effective visualization decisions, or they do not let you easily engage in rich analytical conversations with your data in multiple synchronized perspectives. For customized analysis and design needs, you can use programming based tools, but these require significant technical knowledge to figure out and execute the best strategies. How can you get the most from your data, with the least amount of effort, and in the shortest time?

The Solution: Keshif

Keshif is a new web-based tool that brings life to your tabular data by converting it into a beautiful interactive visual interface. Unlike other tools, it creates an environment where you focus on interpreting your  data, rather than specifying the visualization details and getting lost in the many visual  options that may slow you down, or mislead you. Keshif is designed to fit your data exploration needs, the structure of your data, and expands on the best practices. Your categorical data becomes bar graphs, your numeric data becomes histograms, your time data becomes line graphs, all without any effort. For more in depth analysis, you can view your data by percentiles and map regions. Each record of your data can be shown individually in a list, grid, map, or network (if your data supports it).

Everything in a Keshif data browser is connected and highly responsive so that every action is a potential to a new insight. You can highlight to get a quick preview, filter to focus on details, or lock to compare different sections of your data easily. You can import your data to Keshif from Google Sheets, CSV, or JSON files, and decide which attributes you want to explore. This can be done by summarising their characteristics, and manipulating  your data in various ways to explore different trends and relations. From journalism to government, transportation to finance, and music to sports, Keshif can be used for data in many different domains. With it’s minimal, yet powerful features, Keshif lets you make sense of your tabular data quickly, analyze it in multiple perspectives, and reach new insights.

Keshif-TechChange

Keshif is under active development by Ph.D. candidate M. Adil Yalcin and his advisors Professor Niklas Elmqvist and Professor Ben Bederson at the Human Computer Interaction Lab at University of Maryland College Park. To learn more about Keshif, visit its homepage www.keshif.me, find a topic that interests you across the 150 datasets specially compiled, and watch the short tutorial video

About the Author:

M. Adil Yalcin, is a Ph.D. candidate at the Department of Computer Science at University of Maryland, College Park. His goal is to lower human-centered barriers to data exploration and presentation. His research focuses on information visualization and interaction design, implementation, and evaluation. He is the developer of Keshif, a web-based tool for rapid exploration of structured datasets. In his previous work, he developed computer graphics techniques and applications.

If you have any further questions, join Keshif’s email list or contact yalcin@umd.edu.

adil-yalcin-headshot


How do you make the invisible visible? How can we keep up with our ever-changing world, and how can we utilize the technologies of our time? Upon the completion of TechChange’s Mapping for Social Good course, we have found that some answers lie within the realm of digital mapping and geospatial data collection.

From Theory to Practice

The course features four weeks of case studies and real-world map applications, a diverse set of guest speakers, and innovative tech tools to invoke critical spatial analysis with social and environmental perspectives. Each new week introduced a set of social and environmental themes. Issues such as Water, Sanitation, and Hygiene required an advanced geographic understanding of land use and climate patterns to produce meaningful maps, and cutting edge tools such as CartoDB, Mapbox, and Leaflet empowered our understanding through spatial analysis.

In search of balance, participants discussed the necessary steps in designing an attractive, efficient, and safe urban infrastructure in Abu Dhabi, and discovered the complexity of the plan. Taking into account population, available surface area, and the availability of funds and resources, the course discussion forums were flooded with professional expertise and insight in how to build infrastructure that reflects the city’s urban lifestyle.

But Data Considerations Aren’t Only About Tech

A discussion on ethics can often be overlooked in this technical environment. But in Week 3, Nathaniel Raymond of The Signal Program on Human Security and Technology led a talk that highlighted recurring challenges associated with technology and humanitarian efforts. In doing so he introduced the concept of Demographically Identifiable Information (DII) – a close relative to that of Personally Identifiable Information (PII). His message put forth “Do No Harm” caution to humanitarians, encouraging critical thought and consideration for the most vulnerable populations in our world, remembering that we both hold, yet lack, so much power with technology.

Engaging Formal and Informal Institutions

Of note was the interaction between the global volunteer community of mappers and major donor institutions. A team of geographers and cartographers from the State Department’s Humanitarian Information Unit joined the class to discuss Mapgive and Imagery to the Crowd, a program that provides satellite data to global volunteers during times of crisis, and shows just how far the digital humanitarian community has come in the past decade.

Interactivity in Online Education

Throughout the course, participants presented their digital maps, addressing fundamental questions like, “what is the purpose of this map?” and, “will it give us exactly what we need, or simply what we think we need?” We’ve seen land-use maps of Washington, DC, conflict maps tracking violence against civilians in Libya using QGIS, and district density maps using the CartoDB application.

Upon completion of the TechChange course, “Mapping for Social Good,” we hope that participants feel well-equipped with some of the best mapping resources of our time, and that they have taken their professional experiences to new and challenging levels.

About the Authors
Madeline is a student at James Madison University, where she studies Political Science, Humanitarian Affairs and Geographic Information Systems, with a special interest in Conflict Resolution and International Landmine Prevention. In her free time, she loves to bike, paint, and eat chocolate pie while listening to Dave Brubeck.Madeline Profile Picture

Greg works on training and analytics with the Bureau of Conflict and Stabilization Operations at the US Department of State. He has spent his career working at the intersection of conflict resolution, technology, and the arts. Trained as a mediator, he also worked with the Northern Virginia Mediation Service and the US Institute of Peace. As a technologist, he has leveraged Geographic Information Systems for health interventions, humanitarian response, and conflict analysis purposes. He holds an MA in International Studies from the Josef Korbel School of International Studies at the University of Denver.Greg Maly Profile Picture

Mobile Health: How Far We’ve Come

When I first started in the field of technology for development back in around 2010, I was working specifically in global health tech, and there weren’t too many of us around. The idea of using technology in places besides the developed world was just starting to gain traction, and even then, it was limited to mostly technologists and a few health experts. Pilotitis was infecting everyone, and every project I worked on for the first few years was a pilot of some sort, with no solid plan to move beyond that stage. The focus was on finding tools and concepts that showed evidence of working, although that ended up being a more difficult task than everyone expected!

Recognizing this, the mHealth Alliance (formerly part of the United Nations Foundation) created programs to incentivize all the many organizations out there to move past the pilot stage and begin exploring how to scale their projects, and eventually other organizations followed suit. Even then, though, the health field at large was still a bit unsure about how to treat digital interventions, especially in terms of evaluation. Do you measure the success of an SMS stock monitoring tool by just counting how many times it was used, or do you count the many patients who were treated using those very drugs kept in stock? Is there even one right way to measure it?

Additionally, nobody could really agree on what terms like “scale” and “sustainability” meant for mobile health tools. It wasn’t until more recent years that the space has truly started to embrace that the definition of “scale” and “success” varies for each project, and that planning for sustainability is paramount for a mobile health product to truly make an impact.

These days, among many lessons learned, it’s widely recognized that like any technology, mobile health tools are great for targeted usages, but at the end of the day, they are just tools that cannot solve problems on their own. Even the sleekest vaccination reminder system, for instance, must be accompanied by an equally well-run vaccination program for it to really benefit a community.

The mobile health community, additionally, has expanded significantly to include a wide variety of experts and crossover roles, from doctors to designers and software developers to supply chain experts. This has contributed to an increasingly holistic view of mobile health, rather than the siloed space that it once was – which is a good thing! The more perspectives you incorporate into projects, the more likely you are to come up with a truly innovative and engaging product.

Looking Forward in Mobile Health

It’s hard to say what the next big breakthrough in mobile health will be, but we’re already starting to see a rise in the number of projects that incorporate more advanced technologies like sensors and wearables alongside mobile phones. These types of additions have the potential to reduce the amount of time and resources needed to activities that currently serve as barriers to access and utilization of health services. We’re still figuring out how these sorts of tools can be best incorporated into healthcare, even in the western world, but we’re making progress. The UNICEF Innovation team even just began testing the usage of drones to speed up the process of testing infants for HIV, which brings a whole new meaning to the concept of “mobile” health tools!

Personally, I think that the biggest changes coming ahead in the near future will not be so much in the tools themselves, but rather in how we use existing tools. With the rise of patient records and other consolidated data sources around the world, I think we’ll soon be seeing a bit more of personalized medicine in the developing world, which will help bring customized care to places where it otherwise would have been difficult to provide. Similarly, better data analytics will lead to smarter interventions – for instance, we’ll have a much better sense of exactly what types of diagnoses are prevalent in specific areas, and thus be able to better support clinicians with their precise needs. And it may sound crazy, but if you want to really look ahead, I do think we’re much closer than you’d imagine to our futuristic vision of robots supporting clinics in hard-to-reach areas. The technology for that exists; it’ll just be a matter of finding ways to make it affordable, accepted, and safe enough to use! That would open up all kinds of new doors to allowing patients with mobile phones to directly connect to their healthcare.

Regardless of what the future holds, one way that you can be prepared to participate in it is by learning more about the space at large, which is why the TechChange Mobile Phones for Public Health course is such an exciting resource! I look forward to meeting the students taking it and seeing the kind of impact they’re able to create.

About the Author
Priyanka Pathak is a technologist and digital designer whose work focuses on co-designing and co-creating technologies for social impact, especially in global health and STEM education for women. Currently, she is a Senior Designer at the Design Impact Group at Dalberg. Previously, Priyanka worked as an ICT and Innovation Specialist at the World Bank, in addition to having taught courses around design, technology, and social good at Parsons the New School and the Copenhagen Institute of Interaction Design. Priyanka holds a masters degree in informatics from Columbia University and bachelors degrees in information systems and business from the University of Texas at Austin, and is currently based in Washington, DC.

pathak_profile B&W

Let’s pick up where we left off in Part 1 of our survey design for quality data series, which was inspired by Dobility founder and CEO Dr. Christopher Robert’s presentation in the TechChange course “Technology for Data Collection and Survey Design.” Lesson 1 focused on designing your survey with empathy for field staff and respondents. Lesson 2 highlighted SurveyCTO tools for building in relevance and constraints. With Lesson 3, we’ll jump into a number of ways that SurveyCTO enables you to automate monitoring and workflow.

survey_design_2

Lesson 3: Automate Monitoring and Workflow 

The staffing structure for a typical survey might look something like this: a research team designs a survey. Thousands of miles away, a field team conducts the surveys. The collected data then goes back to the research team for analysis.

The research team wants to be able to monitor the field team and audit their work throughout the process. Supervisors on the field team may also want to monitor their enumerators. And, just to get complicated, the research team may also hire a survey firm to conduct the survey themselves or to provide an additional layer of monitoring for the field team.

In the case of traditional paper surveys, quality checks might include:

  • a member of the research team accompanies enumerators in the field
  • a supervisor reviews surveys as they come in
  • an independent team conducts “back-checks” after initial surveys are completed, to corroborate the results

Many of the quality checks available when conducting a paper survey occur AFTER the initial surveying is complete. You may not know you have bad data until it’s too costly – and too late – to do anything about it.

One of the most compelling opportunities afforded by SurveyCTO is the ability to easily program a number of quality checks into your survey that can automatically flag issues as they arise. Not only that, with a little extra work up-front, you can prep your data to make the transition to visualization and analysis even faster.

Example 1: Audio audits and speed limits
Back-checks are time-consuming and expensive, so why not listen in from the office? You can program your SurveyCTO surveys to randomly capture audio throughout an interview.

Or, even better, pair audio audits with “speed limits,” which allow you to indicate the minimum time that a particular question should take to ask and answer properly. For example, you can program your survey to automatically start recording after the enumerator violates three speed limits – meaning they didn’t take enough time on three different questions within the same survey.

Since audio audits and speed limits are programmed by the research team, the field team won’t know the specifics – they’ll just know that there’s an additional layer of accountability.

Sample speed limit:
speed_limits


Example 2: Automated checks
Our most sophisticated users write quality checks in Stata code, to automatically flag data that doesn’t behave as expected. But we wanted to ensure this best practice is available to all of our users, which is why we’ve built the feature into SurveyCTO.

Spend a few minutes during the survey design phase to set up at least one automated check and you’ll not only be able to identify and address issues right when they arise, you’ll have more reliable data to work with once your surveying is complete.

Sample automated check:
automated_check


Example 3: Concatenate and calculate
Let’s say your survey splits first name and last time into two fields but you would prefer it displays in one field during the analysis stage. You can easily program the form builder to concatenate – or link fields together – so that when you output the data, it’s already formatted the way you want it. You can also set up automated calculations, which can help with analysis or serve as a useful relevance trigger during the survey itself.

Sample calculation:
calculation


Example 4: Visualize and analyze
As soon as your data is uploaded, you can take advantage of our integrations with Statwing, Google Sheets, Google Earth, Stata, Excel, and Salesforce (via OpenFn.org), or export it to JSON or CSV file formats and start analyzing it in the platform of your choice.

Using a mobile data collection platform enables you to skip the laborious and error-ridden step of data-entry. Instead of spending months entering, checking, and rechecking the data you collected – not to mention storing hundreds (or thousands!) of survey booklets – start analyzing your data the day it’s collected.

Sample integration with Statwing:
statwing


Final Thoughts

Just remember that even experienced survey designers struggle at times with developing the best structure for exploring a research question and setting up the systems to minimize the risk of collecting bad data. Hopefully this series on survey design for quality data has given you some ideas for how to approach your next project. And if there are any additional topics you’d like us to cover, please leave them in the comments.

Read Part 1 of the series here. This article was originally published on the SurveyCTO blog

About Alexis
Alexis Ditkowsky is the community and business strategy lead for Dobility, the company behind SurveyCTO. Her experience spans social entrepreneurship, international education policy, higher education, and the arts. She holds a Master of Education from the Harvard Graduate School of Education.

headshot_alexis

Live guest expert sessions are a key, and favorite, aspect of any of TechChange’s four-week, facilitated courses. Held 2-3 times per week, these events give our students the chance to engage with experts in the field and have active discussions. Our guest experts hail from diverse backgrounds and organizations.

Today, we had the opportunity to chat with Melissa Persaud, Director of Partnerships – North America at VOTO Mobile, who will be one of our guest experts for our upcoming mHealth: Mobile Phones for Public Health course. Melissa will be speaking during the second week of the course doing a demo of VOTO Mobile’s tools, before diving into a Q&A session with participants. Check out what she has to say about the field of mHealth!

Can you tell us about your background and experience in mHealth?

As a generalist and M4D enthusiast, I’ve been observing mHealth projects over the past 10 years. Personally, I’m excited by the possibilities technology provides in this space. From the household all the way to major hospitals, there is a role for tech. During my time with VOTO, I’ve been able to explore how pairing mobile phones and information can change and save lives.

How is mHealth incorporated to your work currently?

The beauty of VOTO is its ability to share information and promote behavior change at scale almost instantly. I get to spend my days collaborating with leading health organizations to adapt existing or design new approaches across all health needs. From finding ways to better support, train, and retain frontline and community health workers to thinking about how to disseminate critical and urgent outbreak information directly to households in real time, we are pushing the limits on what you can achieve with a basic mobile phone. I also benefit from learning from other sectors as we co-design projects across all sectors with international and local organizations around the world. For example, we’ve learned that calling Brazilians between 5-7 pm has a 4x higher response rate than 8-10 am. Sharing context-specific information like this helps us all be better development practitioners who provide even better services.

Why do you think mHealth is important / what impact can learning about the use of mobile phones for public health have on development projects?

In my mind, the health sector is one of the most diverse and complex ones out there and there is no silver bullet. With that said, tech does offer some significant enhancements to traditional health projects. You are able to reach more people directly, frequently, and cheaply. This can be incredibly useful ensuring adherence to life-saving drugs or vaccines and it was nearly impossible 15 years ago. Technology also allows us to map the spread of diseases, better understand high need areas, and allocate resources as necessary. Doctors can treat more patients and save lives through telemedicine services. Community health workers can instantly access treatment information for new diseases or rare cases they haven’t been trained on. The list goes on and on. What an opportunity!

What are your thoughts on the future of mHealth, and where you think this field is heading?

I’m particularly interested in demand driven content, where individuals can self-diagnose or learn more about health topics through their mobile phones. Think WebMD on your basic phone. A way people can learn more about their bodies and their health on their own time and without internet connectivity. I’m not sure if this is the future of mHealth, but I will be keeping an eye on it!

We believe mHealth skills have the potential to make a huge impact in your work. Why do you think taking this class is important, and who would you recommend it to (public health professionals, field workers, etc etc)?

One of the biggest challenges in mHealth is that practitioners don’t know where to start. The endless opportunities are often overwhelming and human nature is to stick with the things we know. One thing I hope the mHealth students takeaway from this course is how to think about the problem you are trying to solve and be able to make an informed decision on which mHealth tool will be most appropriate and successful. This skill will prove to be incredibly useful as students advance in their career, in health or otherwise.

Sound interesting and/or valuable to your work? Sign up for our mHealth: Mobile Phones for Public Health class here. Next session begins March 28, 2016!

About Melissa
Melissa Persaud is Director of Partnerships – North America at VOTO Mobile, a Ghana and US-based mobile engagement social enterprise. In her role, she builds and maintains partnerships with impact-oriented organizations in order to provide better choices for more voices around the globe. Personally, Melissa has a passion for program design and implementation, mobile for development (M4D), and financial inclusion. She holds a MPA in development practice from the SIPA at Columbia University and a BA from Lafayette College. Melissa is also a Returned Peace Corps Volunteer (Cameroon ’11-’13) and is currently based in Washington, D.C.

Melissa_Bio Photo

In 2015, TechChange launched the Technology for Monitoring & Evaluation Diploma Program, which combined three TechChange courses (Tech for M&E, Tech for Data Collection and Survey Design, Tech for Data Visualization) into one comprehensive program. The program was meant to give busy working professionals a robust foundation in technology for M&E through the three core courses as well as workshops and office hours with course facilitators. Our first cohort is finishing up the program as we begin 2016, and a new session will launch on January 25.

Today we are very excited to chat with Sonja Schmidt, the Senior M&E Advisor to JSI’s AIDSFree project, who is one of the first participants to complete the Technology for Monitoring & Evaluation Diploma Program: Working Professionals Experience. She discusses her experience with the overall program, how each course influenced her work, as well as how she was able to better understand the use of ICTs in M&E.

How did you come across the Tech for M&E Diploma Program?

A colleague of mine from JSI had sent around some links for TechChange courses. When I clicked the links I noticed the Diploma Program, and thought that this would be a good option to take advantage of the three courses in order to get a wider foundation on the topic.

Have you taken online courses before? Did the program meet your expectations?

I had never taken an online course before, so this was a very new experience for me. I found it challenging in the beginning, particularly with the first course that I took, because I initially felt overwhelmed and struggled a bit with learning how to move around the platform and managing the material.

That being said, the program far exceeded my expectations. I have to compliment TechChange because, being an M&E expert, I look at most material with a critical eye, but I found that the material that was put together and all of the speakers/guest experts were stellar. I was also quite pleasantly surprised by the group dynamics present on the platform. I did not expect this from a virtual group, but in the end there were names that kept popping up, and I actually had the chance to meet someone from the course in person – I am almost said that it has ended.

Are you new to the field of M&E? If not, why did you think this would be valuable to your career?

I have many years of experience in the M&E field. Despite this fact, I realized that the concept of ICT and M&E emerged on the scene pretty suddenly – it did not really exist as an articulated concept even as recently as 3 years ago. I remember meeting someone a few years back who had created his own company around an app meant to improve data collection for surveys, and was surprised because I never thought that that would take off. Now, several years later I find it fascinating how this has become mainstream.

So, my main reason for taking the program was to learn more about this new and rapidly changing field, the intersection of technology and monitoring & evaluation, and get a better grasp of it.

How have you been able to use what you learned in the courses in your work, and how has the program overall been helpful to you?

I have definitely been able to use what I learned in the courses, and the Diploma Program, as foundations for my work. The Technology for M&E course, while a bit repetitive for me sometimes, as I’m an experienced M&E professional, still provided me with exposure to new materials as well as to other people’s perspectives and approaches. The Technology for Data Collection & Survey Design course was not as applicable to my personal work, however it did improve my capacities as an M&E advisor in terms of being able to recommend methods or software, or considerations to take into account, to in-country M&E folks who might be the ones actually designing M&E programs themselves. The Technology for Data Visualization course is the one that had the most impact on my work directly, because a big part of my work is reporting to stakeholders and presenting data. The Introduction to Excel for Data Visualization course was also extremely helpful because it is a familiar software, and Excel is something that I will always use; especially for organizations that do not have much funding, Excel is a very powerful and useful tool.

In general, I think the courses were useful in my work in that when I come across a particular issue, I can now think in a way where I ask myself how I can improve or do something better. I can then go back to the material and target specific areas and continue to use the program material as a tool for learning in my work. I am also currently working on developing a training in Tanzania on data quality, and I plan to discuss with my colleagues ways to use, for example, phones to more quickly submit data from site facilities to our central office.

Interested in the TechChange Technology for Monitoring & Evaluation Diploma Program? Get more information and apply here. Enrollment is open and on-going, but our next batch of courses begins January 25, 2016. It is still not too late to sign up and join this amazing program with participants from all corners of the globe!

About Sonja
Sonja has over 15 years of experience in international public health, with a focus on infectious diseases, including TB, HIV/AIDS and immunization programs. She has long-term country experience in Bangladesh, India, Nepal and Ethiopia and has worked for several UN organizations (UNIFEM, UNICEF, WHO) and numerous USAID-funded projects. Currently as the Senior M&E Advisor to JSI’s AIDSFree project, she oversees and coordinates the monitoring and evaluation of the project and guides country projects in M&E planning, data quality assessment, data analysis and use. Sonja has an MA in medical anthropology and an MPH with a focus on policy and management.

Featured image credit: WOCinTech Chat Creative Commons License

The Current Situation

There’s no doubt that there is a glaring gender gap in tech. The widely accepted number of jobs held by women in the industry is 30%, but when you look at the percentage of women actually filling engineering roles, that figure shrinks considerably.

Let’s take a look at some of the giants in tech. At both Facebook and Google, women make up around a third of the company’s payroll, but only 16% of technical jobs at Facebook and 18% at Google are held by female engineers. At Twitter, it’s only 10%. These figures are the norm across the industry – in Europe, only 7% of engineering jobs are held by women!

Now, this isn’t just a women’s issue, a corporate responsibility problem, or a diversity issue. This gap is hurting companies’ bottom-lines and is detrimental to the industry overall.

If you look at any number of metrics, a gender-balanced team outperforms a predominantly male or predominantly female team. The numbers show that gender diversity has big payoffs. Teams with at least one female executive tend to receive valuations that are 64% larger than companies that only have men in leadership positions.

As Toptal Co-Founder and COO Breanden Beneschott put it, “If men and women are equally intelligent, statistically speaking, then out of the smartest ten people in the world, five should be male and five should be female.” Therefore, “if your team is anything less than an equal balance of men and women, then your team is probably not the best it can be.”

What is being done to address this gender gap?

The good news is that leading tech companies agree on this and they’re launching initiatives to get more women into top engineering positions. The solution here is more complicated than just doubling down on recruitment efforts for female engineers, though. There simply aren’t enough female engineers in the job market right now. While there’s no one reason for this, Girls Who Code founder Reshma Saujani explained that popular culture has a lot to do with turning young women away from tech. Girls take cues from TV shows, fashion magazines, and social media that tech is a man’s domain and figure it’s not a path they should follow.

So companies are trying to get involved at the ground level, not just recruiting computer science graduates but also showing girls at a young age that they actively want them to enter STEM fields, both in the classroom and after they’ve received their diploma. Both Etsy and Intel partner with Girls Who Code and Girl Develop it to build a strong educational pipeline that supports aspiring female developers.

Banner_1

In October 2015, Toptal launched Toptal Scholarships for Female Developers, which will award 12 aspiring female engineers $5,000 and a year of one-on-one mentorship with a senior developer from the network. Toptal is encouraging girls of all ages and educational backgrounds to apply by making a meaningful contribution to open source and then writing a personal blog post about it. They’re announcing one winner per month for a year.

Through partnerships with educational organizations and the creation of mentorship programs, these companies are getting at the root of a systemic issue. There’s a long road to gender parity in tech, but they’re at the forefront of a solution that will bring more female engineers into the industry and give their companies a competitive edge.

About Grace

Grace Fish Headshot
Grace Fish is a writer from San Francisco currently working at Toptal. She graduated with a degree in History from Princeton in June 2015, and has been been living as a digital nomad ever since.

1. Privacy

Responsible data management is not new to development. However, with the use of technology-enabled tools for M&E, it has raised a few challenges related to the privacy of individuals. These include the growing use of biometric data for tracking and sensors to monitor daily habits. The collection of personal financial information and affiliation has also made it vital to consider data security when setting up an M&E framework. This can be addressed through data encryption, ensuring that individual data is not easily identifiable, and developing a policy that ensures responsible data practices. Furthermore, organisations need to be aware of the ethical implication of collecting data on people and the necessity to secure all the permissions and consents required. It is also important to be transparent about the methods of collection, why data is collected and how will it be used with the respective individuals. Finally, ownership has to be explicit when information is shared and a plan should be in place on what happens to data collected once a project ends. In South Africa, the Protection of Personal Information Act, 4 of 2013 also lends a relevant and interesting dynamic.

2. The end-user in mind

To select the most suitable technology-enabled tool(s), taking a human-centered design approach to the selection process will ensure that the organisation does not end up with an irrelevant or unnecessary tool. The approach starts with identifying what is desirable (one should consider project managers as well as community members, i.e. the people who will be using the tool), then viewing the solution through a feasibility and viability lens. This ensures and increases the usability of the tool as well as ensuring that no segment of the community is “ignored” as result of the selected tool, i.e. thinking of the accessibility of the tool and the training that would be required. Once identified, the tool should be piloted on one project before rolling it out.

3. Getting the right balance

Technology facilitates, but does not replace, M&E methodologies such as a well-thought out theory of change and quality M&E plan. So it may be tempting to fall into the habit of selecting or collecting data based on the easiest tool rather than what really matters to your program. Furthermore, technology can lead to over-dependence on digital data and missing the opportunity to observe and interact with communities in order to get a comprehensive picture of an intervention. To get the right balance, one must be very clear on the value the tool will add.

Although there are other factors to contemplate, the above three points offer a good guide to anyone considering the use of technology-enabled tools in their programs. With the ever-growing need to understand and measure impact, the integration of technology from delivery of services and monitoring of interventions to the evaluation of programs will continue as it offers possibilities and innovation to increasing reach, moving to scale and improving the efficiency and effectiveness of interventions.

This article was originally posted on the Tshikululu Social Investments blog. Photo courtesy of Jan Truter Creative Commons

About Amira

photo (1)

Amira Elibiary is a Monitoring and Evaluation (M&E) specialist with 10 years of experience in research, grant-making and program management; over two years of experience in the corporate social investment sector for education, health and social development projects. With a keen interest and extensive experience in democracy, governance, advocacy and rule of law work. Amira holds a Master’s degree in International Affairs from American University and a BA degree in Economics.

TechChange courses are designed with busy working professionals in mind. In any of our courses you will find yourself engaging with a vast network of participants from all corners of the globe who bring with them unique experiences and perspectives.

Today, we are excited to chat with Amy Noreuil, a Technology Advisor working at USAID’s Office of Transition Initiatives. Amy has taken seven TechChange courses to date, both on-demand and facilitated. We caught-up with her to chat about her overall experience with TechChange as well as how our courses have impacted her professional life.

How did you find out about TechChange, and what caught your attention about TechChange courses, or got you interested in taking them?

I’ve been following TechChange for a number of years, but I think the first time I ever heard about it was through a TechChange-hosted happy hour where I ran into Chris Neu, Chief Operating Officer of TechChange. My curiosity was piqued because I always want to know about other initiatives going on when it comes to the use of technology for social good. I love going out and hearing about new projects that are under way to figure out how they could support our work or how we could support them. I’m a contextualist at heart – I believe the impact of technology can vary widely depending on the context – so I’m always interested in learning from the experience of others. I found the sense of community and diversity of students participating in TechChange courses to be one of the biggest assets. Everyone brings a unique perspective to the ‘classroom.’

After completing your first course with TechChange, what made you decide to enroll in more?

The first course I took with TechChange was Mapping for Social Good. After that first class, what drew me in – and what has kept me coming back to TechChange – is the people. To me, virtual learning experiences are inherently more individual experiences, but TechChange courses provide the opportunity to connect with other students and take what started as a quick chat to a more nuanced conversation. The interaction can be customized to what you want and need – a quick exchange of resources (e.g. reports, toolkits, etc.) or a deeper discussion about intended and unintended impact. The user interface is easy to navigate and caters to different learning preferences, including visual learners like me. It provides a high-level survey of topics or applications, while also giving the user the option to dig into the technical details of specific tools.

You’ve now taken seven TechChange courses – how have they impacted your career as a technology advisor for USAID’s Office of Transition Initiatives?

TechChange courses allow me to discover new tools as well as share experiences and insights with a wide range of people. I’m always looking for ways to break out of traditional silos.

The three major ways in which TechChange courses have impacted my work are:

  1. Meeting people who are passionate about the intersection of technology, media & data
  2. Finding tools and workshopping how they could support our partners and programs
  3. Connecting with people who bring different perspectives, ideas and approaches

What is your advice for other students participating in TechChange courses? How can they get the most out of the experience?

Come into the course with an idea of what you want to learn. Set your intention early and be open to change. This learning objective will help you navigate course content and connect with students. The facilitators are very approachable and accessible. I also really encourage participants to meet up in-person and offline with students who live in the same geographic area. There’s no replacing that face-to-face connection. Developing a community of practice and creating an environment that facilitates learning takes time and commitment. I’m excited to see the TechChange community continue to grow and change.

Interested in learning more about TechChange courses? Check out our online course catalog here! We will be launching new sessions of several of our most popular courses in the New Year! 

About Amy

IMG_0117

Amy is the Technology Advisor at USAID Office of Transition Initiatives (OTI) where she supports staff as they decide how to integrate the use of information and communication technologies into their programs. She loves supporting co-creation spaces, leading digital literacy efforts and working closely with local staff to provide an outside perspective on the design of small grants. OTI supports U.S. foreign policy objectives by helping local partners advance peace and democracy.