Wondered who designs and teaches our online courses? You met one of our course facilitators Kendra Keith in a previous post, and today we introduce you to Norman Shamas.

As TechChange’s Director of Curriculum and Pedagogy, Norman brings his passion for education to designing online courses. Norman facilitates our popular online course on Technology for Monitoring and Evaluation and will be co-facilitating our newest course on Technology for Data Visualization this summer. He also facilitated our previous Mapping for International Development course and our customized course on Technology for International Development for IREX.

Norman has quickly become a thought leader in the field of technology for social good. He was recently invited to be part of the review committee for the Development Impact Lab’s Spring Innovate Grant. Additionally, he is also helping lead important conversations on gender and digital security and bringing important techniques and technologies from data science into conversations around monitoring and evaluation.

Before joining TechChange last year, Norman was at Creative Associates International where he developed an internship program. He completed his graduate studies at the University of Minnesota (where he was a graduate student instructor) and undergraduate studies at Arizona State University.

Join Norman in his upcoming Tech for M&E online course that begins Monday, April 20!

Simply including technology in your M&E plan does not lead to better M&E. This was the mantra as I started TechChange’s Tech for M&E online course in January. I heard about this online course from a colleague, and since Commonwealth of Learning is constructing a new six year strategic plan with a crucial M&E component, enrolling in the course was a no brainer. I enrolled and entered a community of more than 180 international development professionals from over 50 countries. All of us in the course agreed that technology is not the main focus for M&E but rather an important enabler to collecting, analyzing and presenting data.

At the end of the course, I reflected on things you must do to successfully integrate technology in M&E:

1. Establish trust between different stakeholders 

When it comes to using technology for data collection, data security and data privacy are very important concerns. As stakeholders are requiring stronger evidence of impact and the use of data to make informed decisions, building a partnership based on trust among all stakeholders is one way to ensure regular flow of data. This includes having all confidentiality and transparency issues addressed with the stakeholders. All stakeholders need to have confidence in each other and in the process and know that their data will be protected, so there must be enough time and resources for engagement with the stakeholders.

2. Spend adequate time in preparation

Another key element is the level of preparation that is required for any technology use for M&E. The use of checklists, ICT in the different steps of a program/project cycle (diagnosis, planning, implement/monitor, evaluate, report/share lessons) and using an M&E expert are all important. All ethical and cultural issues need to be raised with the stakeholders and to the extent possible, addressed upfront.

It is important to ask these questions as you prepare your M&E plan:

  • How does M&E fit into the organization’s strategy and contribute to achieving the goal?
  • What training and support are required so the field workers are trained, assessing if they have good relationships with the community and what technology will enable best data collection?
  • What role will the field workers play to increase responses to qualitative and quantitative data collection?
  • How does one build confidence with all partners so that the quality of data collected enables better analysis and results?

The course checklist of having a quality M&E plan, a valid design to achieve the results and determining the appropriate technology is very helpful. It also emphasizes the importance of testing this with the stakeholders and identifies how to collect data at the different levels of the project and ensure there is a strong motivation to participate.

3. Consider a mixed method approach to data collection

The key focus of my work is in education, both formal and non-formal. So far, using quantitative data has been the norm for any analysis of education provision and its value to society. But mixed method data collection (quantitative and qualitative) is being increasingly used in education, especially to inform the teaching and learning processes. It allows for an understanding of classroom practices, the learner’s context and its impact on education, offering a more holistic view of whether a project has improved learner performance and learning.

Using ICT for mixed methods of data collection has made the processes easier and ensured easier data storage, tagging, and analysis. Mobile phones can be used to record, transmit and tag the data, and data storage platforms can provide easier access to data, aggregate the responses, and analyze.

The course points to four key questions when designing a mixed method evaluation:

  • At what stages/s does one use the mixed method?
  • Are qualitative and quantitative methods used sequentially or concurrently?
  • Will each method have equal weighting or will one method be more dominant?
  • Will the design be at a single or multi-level?

Just plugging technology in your M&E plan doesn’t do much, but there are steps you can take to integrate technology into M&E so that you can collect and analyze data better. These were the takeaways from the course for me, but the course offered many useful insights into the use of technology for M&E like valuable checklists, platforms that can be used, issues to address for the successful use of technology and a focus on mobile phones. I would recommend the course to anyone looking to learn more about the use of technology in monitoring and evaluation.

Author bio

vnaidoo-Oct2012

Vis Naidoo is the Vice-President at Commonwealth of Learning in Vancouver, Canada. He has spent much of the past 20 years involved in the development of open and distance learning systems, educational technology policy and the applications of technology to education – both in South Africa and internationally.

As an online learning community, we are always looking for ways our students can learn more effectively. Many of our amazing alumni, who take our online courses on top of their full-time jobs, have used what they learned in our courses to accelerate their careers, or successfully launch or complete various projects. But we seldom see how our students are learning. We came across the work of Katherine Haugh in our twitter feed when she posted a picture of her graphic notes for our on – demand course on Mobile Data Solutions.

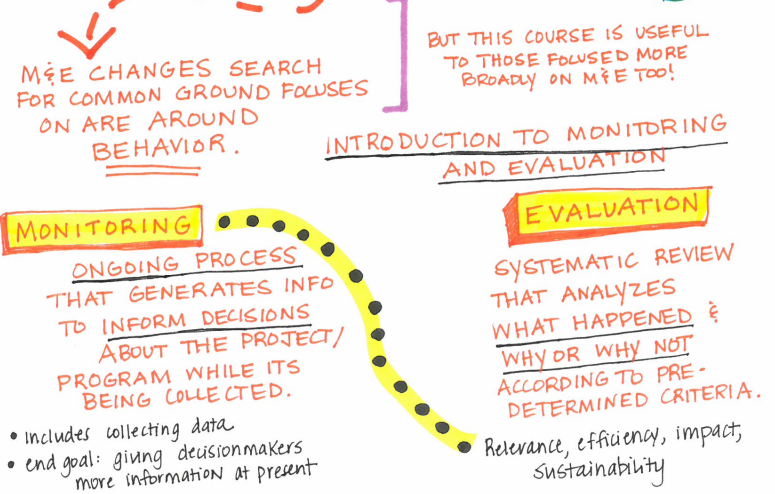
Since these notes have been helpful for Katherine, we wanted to make them available for the TechChange community, we are excited to have Katherine help us as our graphic facilitator for some of our live events in our upcoming courses. She already took notes for one of our live sessions with guest expert, Vanessa Corlazzoli of Search for Common Ground in our Tech for M&E online course.

A snapshot of Katherine's notes for our guest expert session with Vanessa Corlazzoli in our Tech for M&E online course

Some of Katherine’s notes for our guest expert session with Vanessa Corlazzoli in our Tech for M&E online course

Since taking notes by hand is found to be more beneficial than taking notes on the computer, we sat down with Katherine to learn more about her note taking strategies and any tips she has for those of us who would like to get started.

How did you hear about TechChange?
I heard about TechChange through Twitter. I am new to the M&E field, so I am constantly looking for online courses that relate to evaluation, especially ones that focus on combining technology and international development initiatives.

How long have you been taking notes by hand?
I have been taking notes by hand since I was in the fifth grade. In middle school, I took all of my notes by hand and always carried a bag of multi-colored pens around with me. What I like most about note-taking is being able to use my notes as a learning or discussion tool (for myself and others). When I was in college, I worked as a note-taker through the McBurney Disability Resource Center at the University of Wisconsin-Madison. I worked as a notetaker for a variety of courses–from Microeconomics to Global Health and Poverty–and I loved it. (Not to mention, I was being paid to attend my own classes. It’s hard to beat that!). Drawing out historical events or evaluation plans helps me to visualize and better understand what I am thinking and also allows me to share my ideas and thoughts with others in a concise and creative way. I enjoy taking extremely complicated issues or concepts and making them simple and easily digestible.

Why handwritten note taking? What are the pros and cons?
Many of my friends and professors asked me this same question. There are countless pros to taking notes by hand:

  • You understand better. It requires that you understand and think through what you are writing because everything you do is intentional when you takes notes by hand.
  • You have more control over the style and layout of your notes. There is more room for creative expression.
  • It forces you to learn as you write — which is the main purpose of taking notes.

The major downsides to taking notes are hand cramps (yes, this is a thing) and not being able to catch every word, detail or concept. You have to work speedily and you run the risk of missing some points.
However, if you are able to capture the major points (for yourself to remember later or to relay to others) you’ve done your job.

What are some of your strategies to take great notes?
The three important strategies I suggest are:

  1. Find the right mix for you (and your audience): For me, writing on a white paper with enough text and symbols works the best. Remember to keep the notes short, and have triggers in key words, images, or symbols to help jog your memory when looking them over.
  2. Get the right tools: Try out different options to know what works best, I like using darker base colors, and bright colors to highlight main points.
  3. Make it personal: Write notes in your own words, I also include dorky jokes in my notes to help me recall what I wrote.

What is your advice for people who want to get started with note taking?
Just give it a go! You’ll be surprised by how easy it is and remember, you don’t have to be an artist to be a brilliant note-taker. Take a concept that you know very well and try to draw it out. It could be in list format or with pictures–whatever makes the most sense to you!

If you want to start taking beautiful notes but can’t stay away from tech, you can also use MindManager as one of our other alumni, Daniel Acosta did in our previous Tech for M&E course.

You can see more of Katherine’s beautiful notes on her blog. Stay tuned to see more of Katherine’s notes for TechChange’s upcoming courses as well!

About Katherine

KHaugh Headshot
Katherine Haugh graduated Phi Beta Kappa from the University of Wisconsin-Madison with degrees in Political Science, International Studies, and Professional Chinese Communication in May of 2014. As an undergraduate, Katherine developed an interest in a wide range of security issues—from nuclear non-proliferation to counterterrorism—as well as a regional interest in South Asia. She is currently a merit scholar at the International Student House and works as a Research Assistant at Innovation Network, a nonprofit evaluation firm in Washington, D.C. She is a long distance runner, board game enthusiast, hiker and lover of gummy vitamins.

PreMAND field workers testing data collection tablets in Navrongo, Ghana (Photo: N. Smith)

Mira Gupta, one of the star alumna of our courses on Mapping for International Development and Technology for Monitoring & Evaluation (M&E), is a Senior Research Specialist at the University of Michigan Medical School (UMMS). Last October, USAID awarded UMMS $1.44 million to assess maternal and neonatal mortality in northern Ghana. This 36-month project, “Preventing Maternal and Neonatal Mortality in Rural Northern Ghana” (also referred to as PreMAND: Preventing Maternal and Neonatal Deaths) will help USAID, the Ghana Health Service, and the Ghana Ministry of Health design interventions to prevent maternal and neonatal mortality by investigating the social, cultural and behavioral determinants of such deaths across four districts in northern Ghana. For this project, UMMS will be partnering with the Navrongo Health Research Centre and Development Seed.
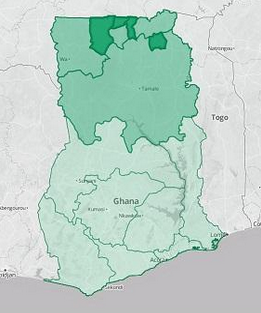
Project Regions and Districts

Project Regions and Districts

We sat down with Mira to learn more about this project and how her TechChange trainings in digital mapping and technology for M&E gave her the skills and background she needed to develop her team’s project in Ghana.

1. What interested you in taking the Mapping for International Development and the Tech for M&E online courses?
I was in the process of trying to learn everything I could about our GIS options when I heard about TechChange’s Mapping for International Development course. It provided a fantastic introduction to the range of approaches being used on international development projects and the variety of organizations working in that space. The course material helped me identify which types of visualizations would be most appropriate for my team’s research. I especially benefited from the many sectors represented in the TechChange sessions because while I was trying to create a project for the Health sector, I actually learn best through a Democracy and Governance framework given my previous background in this field. TechChange provided access to mapping specialists in both areas through its instructors and other class participants.

Just as I heard of the mapping course right as I needed it, the same thing happened again with the Technology for M&E course, which I took a year later. By that point, the PreMAND project had just been awarded and I learned that I would be responsible for the evaluation components. I was excited to take the TechChange course because I knew it would provide a great overview of the many different tools being used, and that I would benefit immensely from the participation of classmates working on projects in similar settings. As expected, the content presented was incredibly valuable in informing our project approach in terms of our field data collection, methods of analysis, and presentation of findings.

2. How did the mapping component of this USAID-funded project come together?

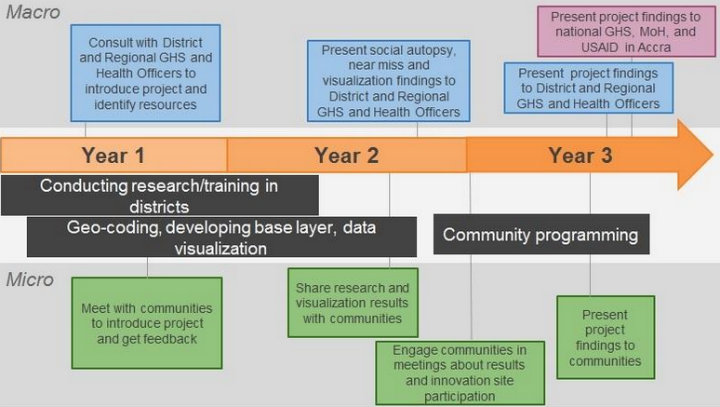
The Three Project Phases: Research will inform the visualisations, which will inform programming

The Three Project Phases: Research will inform the Visualisations, which will inform Programming

While working on a maternal and neonatal health qualitative study a couple of years ago, I sensed that there were themes and patterns in the data that were difficult to verify since the locations of the respondents had not been geocoded. Some of the variables indicated 50/50 probabilities of any particular outcome, which seemed to suggest that there was no pattern whatsoever when viewed as a large dataset. Because my background is in Democracy and Governance, I used election maps to illustrate to my research team that once geocoded there might in fact be very distinct geographical trends in the data, drawing parallels to the locational breakdown of political party support in the United States.

I was in the process of researching mapping resources when I first heard about the TechChange’s Mapping for International Development course, and through the course I met some of the mapping experts that ultimately served as key resources in the development of our project strategy. The course gave me the necessary base knowledge to effectively liaise between our health researchers and the mapping experts to determine the best approach to meet our data visualization needs. We were extremely fortunate to have USAID-Ghana release a call for outside-the-box submissions under its Innovate for Health mechanism, right as we were developing our program concept.

3. What are the biggest challenges you anticipate in undertaking this project?
For the visualization component, generating the base layer maps will be more difficult than we originally anticipated. The various pieces of data we need are spread throughout different government sources such as the Ghana Statistical Service, the Lands Commission, and the Ministry of Roads and Highways. We will need to consult with each of these groups (and likely many others), to explore whether or not they will allow their data to be used by our project. It will require some agility on our part, as we need to stay flexible enough so that we collect any outstanding geographic data we may need through our team of field workers. While there are many moving pieces at the moment, it’s exciting for us to think that we’re building what may be the most comprehensive geographic base layer map of the region, as an initial step in developing our health indicator analysis tool.

There are also a handful of challenges related to evaluation. The primary purpose of our project is to provide new information to clarify the roles of social and cultural factors in determining maternal and neonatal deaths, and shed light on a valuable set of drivers which up until now have been unclear. We are currently in the process of finalizing our M&E framework, which has been a complex process because our project doesn’t fit the mold that most performance indicators are designed for. As a result we’ve been carefully drafting our own custom indicators through which we’ll measure our project’s progress and impact.

One of our most interesting evaluation challenges has been the development of our Environmental Mitigation and Monitoring Plan, which is traditionally intended as a tool for implementing partners to take stock of the impacts their work could have on the natural environment. In our case, we’re using it as a tool to think through our ethical approach to the potential impact of our project on the social and cultural landscape, given the challenges associated with collecting very sensitive health information and the need for data privacy. It’s pushing our team to think through every step of our project from the perspective of our various stakeholders, and has yielded many valuable insights that have strengthened our program approach.

4. What are the tools that you became familiar with in Mapping for International Development and M&E and plan on using in this project and how will you apply them to your project?
I came into Mapping for International Development knowing very little about the resources available in that space. Several of the tools that I became familiar with through the class, such as OpenStreetMap, MapBox and QGIS were highly applicable to our project in Ghana. After participating in the session led by Democracy International and Development Seed, I reached out to those instructors for their input on how I could best translate my project concept into actionable steps.

The visualizations I hoped to create were complex enough that I soon realized it would make the most sense for our research team to work directly with a mapping firm. We were so impressed by the technical feedback and past projects of Development Seed that we established a formal partnership with them and worked together to refine the vision for the project that was ultimately funded. TechChange’s training gave me the knowledge I needed to select the right partner and understand how best to combine our research goals with the available mapping resources to maximize our project’s impact.
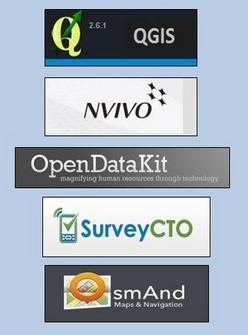
Programs used on the PreMAND project

Programs used on the PreMAND project

In Technology for M&E I learned about the capabilities of different devices, survey apps—those able to capture geodata were of particular interest to me—and even project management tools. There were many helpful conversations both in the class sessions as well as in the participant-led threads around the data collection process, data privacy, and the ways in which project findings can be best communicated to a variety of stakeholder groups. What I found to be most relevant and applicable to our Ghana project were the conversations surrounding human-centered design, and the use of rich qualitative data. I gained a lot from the session led by Marc Maxson of GlobalGiving, who discussed which forms of data are the richest and easiest to interpret. The University of Michigan and our partner the Navrongo Health Research Centre already excel in qualitative data collection techniques, but the conversations throughout the TechChange M&E course inspired some new ideas as to how we might incorporate multimedia such as video and photographs in our qualitative data collection process to make our project deliverables that much more substantive.

5. What is your advice for researchers working to integrate more data visualization and mapping in their research and project interventions?
My advice would be to focus on the end user of your data and identify their needs and interests early in the process. That clarity can then be used to inform 1) what content will be most useful, and 2) what presentation format(s) will be most effective. It’s important to do some form of a needs assessment and let stakeholder feedback guide the project’s design.

In the case of our Ghana project, we are implementing a two-prong approach to our visualizations because both the government representatives and our donor will find an interactive web application most useful, while local community members in the rural North will benefit more from group discussions centered around printed maps.
Feedback loop with two stakeholder groups: the government of Ghana and local communities

Feedback loop with two stakeholder groups: the government of Ghana and local communities

It is common to sometimes present health indicator data solely as points on a map, but we are designing our visualizations to be much more detailed with background layers including health facilities, schools, compounds and roads so that those viewing the health indicator data can orient themselves a bit better to the local context. Had our end-users only been the leaders of those individual communities such detailed maps may not have been necessary. Similarly, the visualizations for one stakeholder group might incorporate a lot of words or even narrative stories based on their level of education, while for other stakeholders, those visualizations will be more image-based and we’ll orient them to the maps through presentations in their local communities.

About Mira Gupta

Mira Gupta

Mira Gupta is a Senior Research Specialist at the University of Michigan Medical School (UMMS), where she focuses on program design, strategy and evaluation. She has developed successful international aid projects in 18 countries, including 13 in Africa. Mira began her career in the Democracy and Governance sector where she worked for organizations such as IFES, the National Democratic Institute, and the Carter Center. She also developed projects in the Economic Risk and Conflict Mitigation sectors before transitioning into Global Health. Her research on the effects of local power dynamics on health-seeking behavior in northern Ghana is published the current edition of Global Public Health.


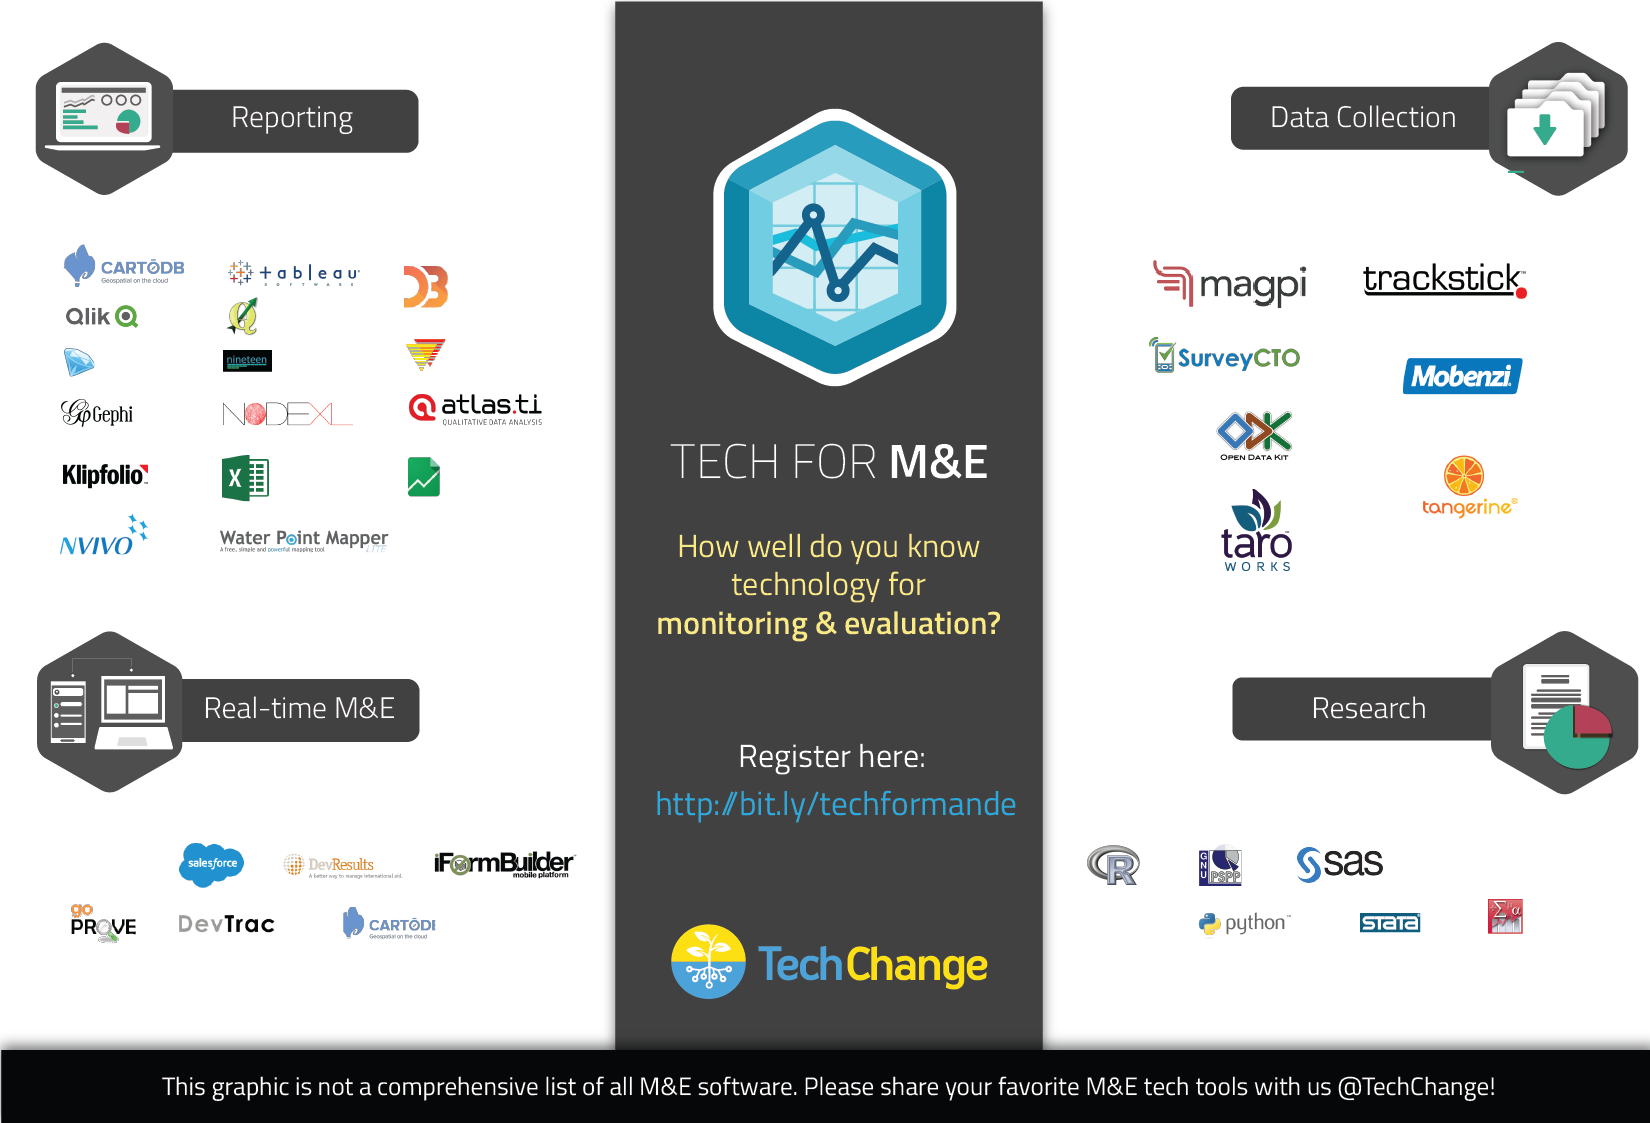
With the rapidly growing field of monitoring and evaluation, there are many technology tools that are designed to help the many roles of M&E practitioners. The fastest growing area has been digital data collection, which currently uses mobile phones and portable GPS systems. Reporting has become easier with all the tools for data visualizations and data cleaning. There are also many research options with statistical software and programming languages for data entry, documentation, and analysis. In addition, real-time M&E tools let you do program and data management with real-time project updates. What we found in the course was that there are tech tools that integrate multiple aspects of M&E.

Here are several of the tools we discussed in the inaugural round of our Technology for M&E online class last fall, as crowdsourced by over 100 IT experts and M&E practitioners based in over 30 countries. In the next iteration of this course, we’ll be covering some of the latest tools including satellite imaging, remote sensors, and more.

What M&E technology tools do you use? How has your experience been with these tools listed? Are there great tech tools for M&E that we missed? Please share with us in the comments or tweet us @TechChange.

Interested in learning about these tools more in depth? Join us for our popular Tech for M&E online course that runs 14 September – 9 October.

GIZ Nepal participants Pushpa Pandey, Valerie Alvarez, and top TechChange student Bikesh Bajracharya with TechChange Communications Associate Samita Thapa, (and TechChange cubebots).

In our most recent mHealth online course, twelve participants from GIZ (Deutsche Gesellschaft für Internationale Zusammenarbeit) Nepal enrolled in the course to support its mHealth pilot for adolescent sexual and reproductive health. This holiday season, I was fortunate enough to return to my native home of Nepal to meet these TechChange alumni in person at the Nepali-German Health Sector Support Programme (HSSP) at their new office in Sanepa, Nepal. Since the September 2014 mHealth pilot launch, more than 150,000 adolescents have used their interactive service.

Nepal’s National Health Education, Information and Communication Center (NHEICC) developed a National Adolescent Sexual and Reproductive Health Communication Strategy (2011 – 2015) that stressed strongly the use of modern methods of communication in its implementation. GIZ, Health for Life (H4L), and the UN Population Fund partnered under NHEICC’s leadership to initiate this SMS based mHealth project – the first in Nepal. The SMS messages and interactive package focus on delaying marriage and pregnancy, healthy timing and spacing of babies, health and hygiene, and addressing gender based violence. The local mobile services provider, Nepal Telecom and NCELL, distributed the interactive SMS package that includes an encyclopedia, role model stories, quizzes, and a hotline for further questions.

Mr Khaga Raj Adhikari, Minister, Ministry of Health and Population launching ‘m4ASRH’ (Mobile for Adolescent Sexual & Reproductive Health) on 18 September 2014.

Mr Khaga Raj Adhikari, Minister, Ministry of Health and Population launching ‘m4ASRH’ (Mobile for Adolescent Sexual & Reproductive Health) on 18 September 2014.

Since Pushpa had shared the status of the GIZ mHealth pilot in Nepal as her final project for the mHealth online course the day before we met, it was especially great to catch up with her in person! She expressed that this mHealth course was much more engaging and fun to complete than other online courses she has tried out. Bikesh, the top user in our course with over 400 tech points, is new to the GIZ team and very excited to apply what he has learned in the mHealth course to his work in Nepal. Valerie recently arrived in Nepal and very new to the GIZ-team, was also excited to learn how much the other participants were engaging and that she can still access all course material for four more months.

All three GIZ Nepal participants shared their astonishment on how many tech points Bikesh was able to stack up in the course and also the fantastic course facilitation by Kendra. They also admitted that hearing Pushpa present in the mHealth course gave them insights that they weren’t aware of even though they work at the same office. While taking a technological approach to development projects in a country like Nepal can be challenging, it is an even bigger challenge to get the government’s buy in. It was exciting to learn that despite some hurdles, this mHealth pilot was an initiative supported by the government of Nepal.

We are excited for the future of mHealth in Nepal and wish GIZ all the best in their continued success! We are also excited to welcome six more participants from GIZ Nepal in our upcoming Technology for Monitoring and Evaluation course in January to better measure the impact of this mHealth pilot! It is wonderful to see how GIZ is committed to mHealth and M&E through their investment in technology capacity building in Nepal.

Photo Source: EvalPartners

Today marks the first day of the International Year of Evaluation, which kicks off with an official celebration at the UN Headquarters in New York City. More than ever, evaluation is becoming increasingly important in international development. The global EvalPartners and the United Nations Evaluation Group officially declared 2015 as the International Year of Evaluation earlier this year. As the Millennium Development Goals (MDGs) will be replaced by Sustainable Development Goals (SDGs) in 2015, measuring results and impact of development activities is increasingly critical. How can the international development community align their monitoring and evaluation skills with new technology to make progress toward the SDGs?

TechChange couldn’t be more excited to kick-off 2015 with the launch of the next round of our online course on Technology for Monitoring & Evaluation. Starting January 26th, this four week course will explore the vital role of technology in enhancing monitoring and evaluations efforts which could have a critical impact on SDG fullfillment. Sign up here to join the learning community!

At TechChange, we’re always looking for ways to make online learning more interactive, engaging, and relevant for busy, global professionals interested in technology and social change. One way we do this is by bringing together our online TechChange community offline with hybrid learning. Specifically, we try to overlap the schedule of some of our online courses with industry events such as the recent M&E Tech Conference and annual mHealth Summit. We also arrange in-person meet-ups in various cities across the world including happy hours in Washington, DC and other meet-ups including most recently in Lusaka, Zambia.

Last month, we launched our very first round of TC111: Technology for Monitoring & Evaluation with a class of over 100 participants. As one of the top guest experts of the online course, Christopher Robert, who is CEO of Dobility Inc. and a Harvard adjunct lecturer, joined us in the first week of the course while he was traveling in Zambia. To take full advantage of the course, some of our participants based in Zambia asked him if he would be willing to meet with them in Lusaka. So, three of these M&E tech course participants (Ladislas, William, and Mine) met Christopher and his colleagues on the same day to continue the technology for M&E discussions from the online course in-person.

Here’s what happened at the TechChange Tech for M&E meet-up in Lusaka:

Reuniting alumni from different communities
It turned out that Ladislas, William, and Mine had already known each other as alumni of the Global Health Corps (GHC) fellowship. According to Mine Metitiri, a Senior Research Associate at the Zambia Ministry of Health, “A number of Global Health Corps fellows are taking the TechChange Tech for M&E online class and we recommended Chris to be a speaker at our annual training at Yale. Hopefully it works out because he had a lot of great things to say that are relevant to our fields of work.“

Strengthening online connections and learning offline
TechChange alumni such as William Ngosa who works at the Ministry of Health in Zambia appreciated the chance to reunite with his GHC colleagues and to meet Christopher and his team members, Faizan and Meletis. “It was a privilege to meet one of the speakers in the online course to provide a meaningful and enriching learning experience,” said William.
Christopher Robert and his team really enjoyed meeting the Zambia-based course participants as well. “It was lucky that we had the chance to meet!” said Christopher. “These Tech for M&E course participants are doing some wonderful things with ICT for social good there in Zambia. It’s always inspiring to meet people doing good work!”

Sharing good news of a job offer for M&E consulting
One of the participants, Ladislas Hibusu, received a M&E consultant job offer after interviewing with Jhpiego while taking the M&E online course.

“At this M&E meetup in Lusaka, I mentioned that during the M&E course, I interviewed for a position at Jhpiego. I am happy to announce that I have been offered an M&E Consultant role and thanks to the valuable insights to this course, as I was able to apply the knowledge I learned in the course. Although I have had limited experience in applying much of my M&E theoretical work in the field, I am happy to say this Tech for M&E online course is addressing most of challenges that I anticipate in my new role.” – Ladislas Hibusu

Everyone congratulated Ladislas and Christopher Robert joined us for another live event the following week wanting to continue the discussions with other participants in our course.

Several of TechChange’s online courses are designed to facilitate interactions like the one in Lusaka. Participants from all over the world are able to connect with like-minded professionals in the international development sector and continue discussions on specific topics. Watching live and recorded videos, completing different activities, and participating in ongoing discussions on an online forum combined with offline, in-person learning is really what enriches e-learning.

Interested in technology for M&E and want to connect with other M&E practitioners across the world? Register now to lock in early bird rates for our next round of our Technology for Monitoring & Evaluation online course which runs January 29 – February 20, 2015.

On September 25 and 26, over 200 development practitioners and technologists filled FHI 360’s conference rooms and hallways in Washington D.C. to discuss the intersection between technology and monitoring and evaluation (M&E). Some of the conference attendees included participants and guest experts in TechChange’s ongoing online course on Tech for M&E and it was great meeting so many these online course participants in person and offline.

Supported by the Rockefeller Foundation, GSMA, and FHI 360, the M&E Tech Conference was a two-day conference held in D.C. (followed by another one event in New York) to discuss the emerging role of technology in M&E and its implications to everyone involved in the international development industry. The release of the discussion paper, Emerging Opportunities: Monitoring and Evaluation in a Tech-Enabled World kicked off the first panel, followed by two days of great panel discussions and engaging break-out sessions. The event also featured a panel facilitated by TechChange online course facilitatorKendra Keith on “What’s Next in Visualizing Data for Better Decision Making?” and a lightning talk on ‘How to Use APIs for Real-Time M&E’ that I presented.

In case you didn’t make it to the D.C. M&E Tech conference, here are a few key takeaways from the event.

1. Technology is not a substitute for good M&E methodologies

One of the panelists perfectly summed up the current state of technology in M&E from a technology perspective: it is not always clear why the M [monitoring] is associated with the E [evaluation]. While technology has made data collection and reporting easy, making sense of the data and how it affects programming still requires newer tools and M&E methodologies.

Good M&E requires capturing and analyzing both quantitative and qualitative data. While there are emerging M&E tools (e.g., SenseMaker) and techniques (e.g., natural language processing), cost and expertise continue to make capturing and analyzing qualitative data difficult. As mixed methods–using both qualitative and quantitative data — are discussed more in an M&E setting, practitioners still have a great deal of work to do.

Kerry Bruce speaks at the first panel

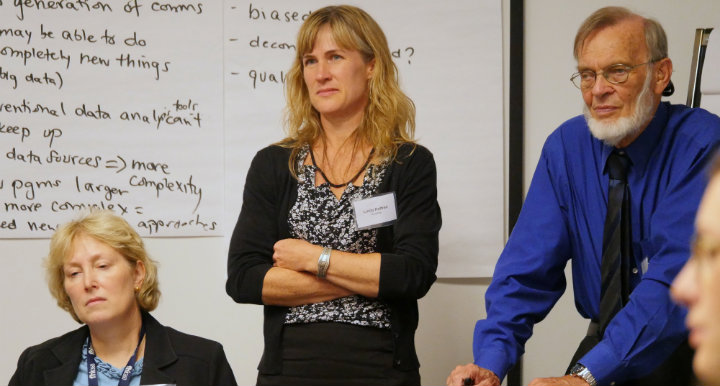
Kenneth M. Chomitz, Kerry Bruce (a guest speaker for TechChange’s Tech for M&E course), and Maliha Khan discuss the current state of Tech for M&E

Mobile phones have been a hot topic in development, but one of the lightning talks revealed a surprising fact: Mobile surveys are not as effective as we think they are. The average response rate for surveys conducted in-person was 77% compared to 1% for mobile phone surveys. While the comparison may not be fair, it is worth noting that the introduction of any technology also requires M&E.

2. Technology introduces new data issues to M&E regarding responsibility, security, and selectivity biases

During the first panel, one of the panelists mentioned that the next “scandal” in development will be about revealing sensitive data. While not a new topic in development, data responsibility becomes increasingly important with the introduction of technology. Unfortunately, data security was primarily relegated as a panel (Whose Data? Whose Privacy?) and a shout out as one of the 9 Principles for Digital Development. This panel also marked the release of the Responsible Development Data Guide, a resource I co-authored, that focuses on protecting digital data and beneficiary privacy in international development.

Linda Raftree and Michael Bamberger lead a break-out session

Linda Raftree (a regular TechChange guest expert) and Michael Bamberger lead a break-out session discussing the emerging opportunities and challenges of using ICTs for M&E

Another common problem that arises with introducing technology to M&E is selectivity bias. Digital surveys tend to be limited to digitally literate populations with access to technology. Yet, even digital literacy and access to technology doesn’t guarantee a truthful response. For example, the panel on data privacy shared that women often didn’t respond truthfully to mobile surveys because their husbands or family members often monitored their personal phones.

Technology also biases researchers and evaluators towards quantitative methods and data. Qualitative data collection, analysis, and visualization software has not kept pace with tools for quantitative data.

3. Data matters more than ever in development

Recognizing the challenges and opportunities technology brings to M&E, the event included many conversations on data. There were break-out sessions on topics like data visualization, leveraging big data, how mobile phones can help in M&E, data security issues, and more.

Data visualization

The data visualization panel showed that there are a lot of new techniques to visualize data. Network visualization is a fantastic way to view a system (e.g., an organization or a program). It’s a simpler way to see where multiple links connect and understand where they need to be strengthened. Mapping allows for easier analysis of aid efficacy. Development Gateway presented their Aid Management Platform with its mapping feature that is aimed at governments in countries with development programs. In particular, they highlighted the success in Malawi and their public facing site with an interactive map. Excel–the tool that most people have and use to create pie charts–can be used to create some outstanding visualizations.

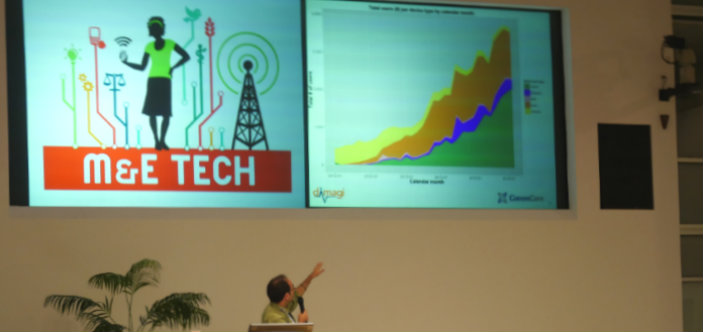
Neal Lesh of Dimagi presents at a Lightning Talk

Neal Lesh of Dimagi presents trends in mHealth systems from over 175 CommCare projects

Open data

Most importantly, we are all looking forward to the day when open data is the standard. Many organizations spend a lot of time and money collecting the same data. If open data was the standard, available data can be used as baselines and potentially show impact after a project. Open data can also push for data structure standards (e.g., IATI) and allow data to be decentralized with application programming interfaces (APIs) connecting the data sources.

The challenges technology introduces to monitoring and evaluation, like data security and access, are topics we are also currently discussing in our Tech for M&E online course with a class of 100 students from all over the world. Due to popular demand, we are offering the next Tech for M&E course in January 2015.  If you are interested in joining the discussion, apply before November 1 to get $100 off the full price of the course during this early bird discount period for the next Tech for M&E course.

If you did attend the event, what did you take away from the conference? Did you attend the conference in New York? Share some of your highlights and insights!

In his 2006 TED talk, Hans Rosling used data visualizations to deconstruct his students’ assumptions about the ‘developed’ and ‘developing’ dichotomy of countries. He looked at the patterns and demonstrated how they were easily recognizable and showed something contrary to the original belief. Pattern recognition is the core power of data visualization and more companies are embracing the notion of  “putting humans back in the decision making process”.

Good data visualizations make patterns and outliers easy to recognize and aesthetically pleasing. The data are “liberated” from numbers and letters into a form that can be easily analyzed and understood by everyone.

Here are some great examples of liberating data through data visualizations

1. Microsoft’s SandDance Project

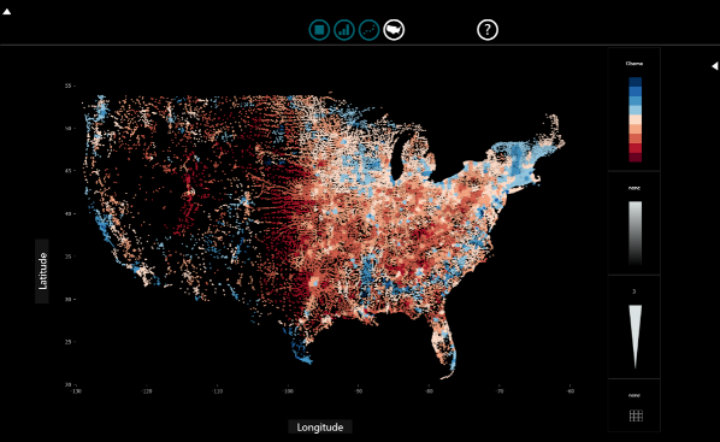
Microsoft recognized the importance of humanizing data with the SandDance project in terms of designing the data exploration experience using “natural user interaction techniques.”

SandDance

2. Cooper Center’s Racial Dot Map of the US

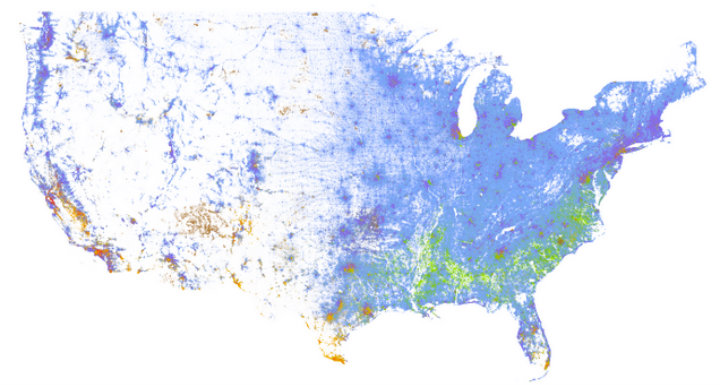
US Census data is made freely available online for anyone to transform into a complex and understandable visualization. The data is available geocoded and as raw survey results. Last summer Dustin Cable took the 2010 census data and mapped it using a colored dot for every person based on their race: blue is White; green, African-American; red, Asian; orange, Hispanics; and brown, all other racial categories. The resulting map provides complex analysis quickly.

USA Racial Dot Map

At a glance, it is easy to see some general settlement patterns in the US. The East Coast has a much greater population density than the rest of America. It slowly gets less dense until the middle of America where there is extremely low density until the West Coast. Cities act as a grouping point: density typically decreases in relation to the distance from a city. The population of minorities is not evenly distributed throughout the US with clearly defined regional racial groupings.

San Luis Obispo, CA

As you scan through California, an interesting exception stands out just north of San Luis Obispo. There is a dense population of minorities, primarily African-Americans and Hispanics. A quick look at a map reveals that it is a men’s prison. With more data you can see if there are recognizable patterns at the intersection of penal policy and racial politics.

3. Google Public Data Explorer

Google has created dynamic visualizations for a large number of public datasets. There are four different graph types, each with the ability to examine the dataset over a set period of time. With the additional element of time, new patterns can emerge.

Examining the World Bank’s World Development Indicators data set to compare fertility rate and life expectancy a pattern emerges: as life expectancy increases, fertility rate decreases. However, some notable exceptions occur. In 1975, Cambodia has a life expectancy slightly over 20 years, less than half of most countries with a similar life expectancy. It is also the year the Khmer Rouge took power leading to mass killings in Cambodia.

This exception to the normal pattern shows how strong of an impact a single event made. Data visualization makes recognizing this pattern and outliers as easy as watching a short time-lapsed video.

I’ve always believed that data are more than just collected information. Data have a purpose and are meant to be analyzed. New technologies have made visualizing data easier than ever and the data are more accessible to everyone.

What are some of the best data visualizations that you have seen, or maybe even created yourself? Please feel free to share in the comments or tweet @normanshamas or @TechChange.

Want to learn more about data visualization and analysis? Enroll now in TechChange’s new online course on Technology for Data Visualization and Analysis  that runs June 1 – June 26, 2015.