By Samita Thapa and Sara Pitcairn

The possibilities for 3D printing are endless. While this may scare some of us, the potential for innovation is exactly what excites us here at TechChange! Imagine being able to quickly manufacture reconstruction materials for disaster response, 3D print homes in refugee camps, or 3D print a human heart to save a life.

But this cutting-edge innovation can also seem difficult to wrap your head around. How does it work? How do you begin? Here is an example of how an idea can become a product through 3D printing:

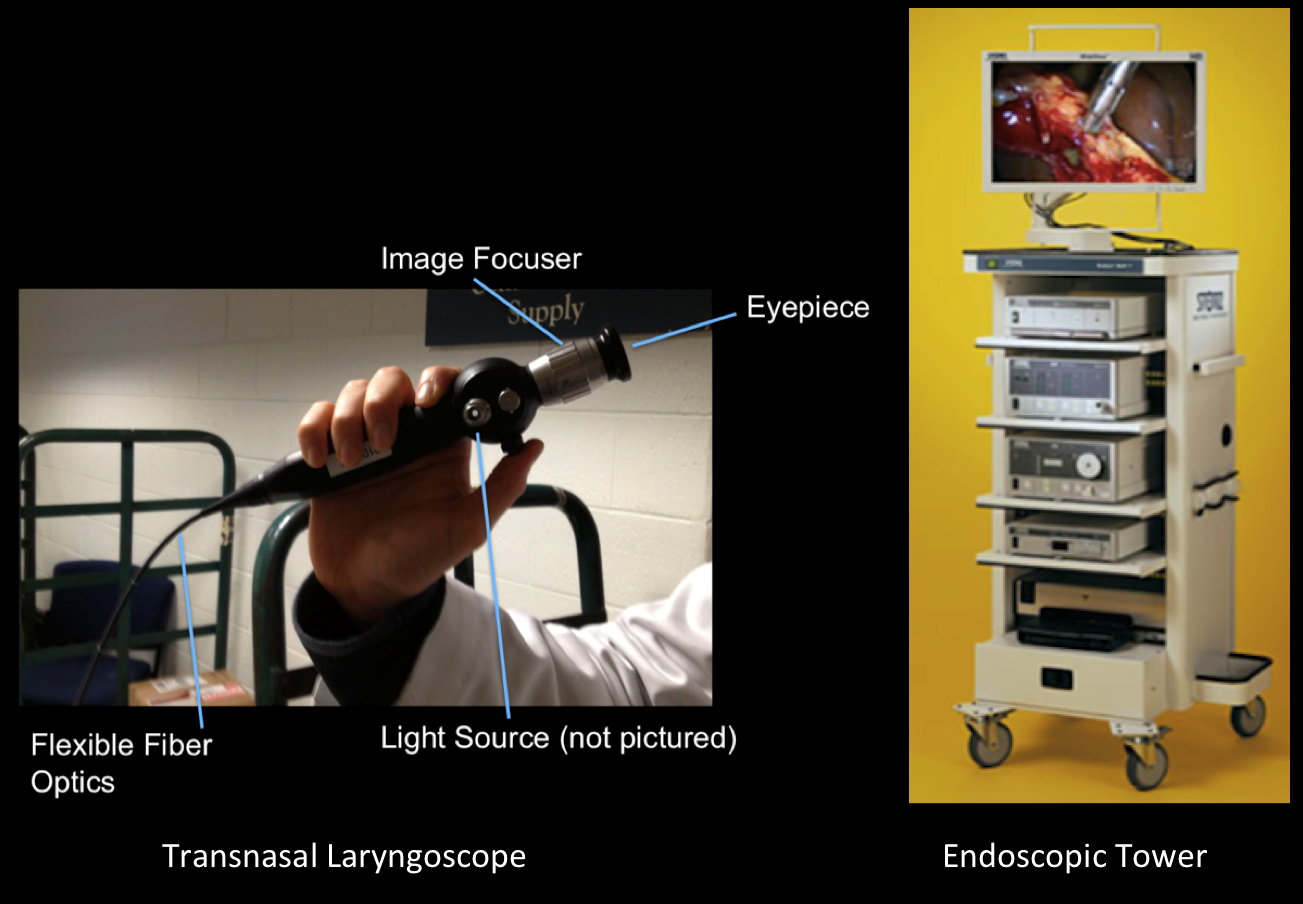
Dr. Boris Paskhover at the Yale School of Medicine saw a need for a portable transnasal laryngoscope with image and video capture capabilities. A transnasal laryngoscope is a handheld medical device that allows Ear, Nose, and Throat (ENT) physicians to examine a patient’s voice box and diagnose and treat ENT disorders (such as cancer of the throat or thyroid). But the equipment that captures images and videos from a laryngoscope, an endoscopic tower, is expensive and difficult to transport, making it infeasible for use outside of a hospital setting.

Laryngoscope and Endoscopic Tower

Imagine
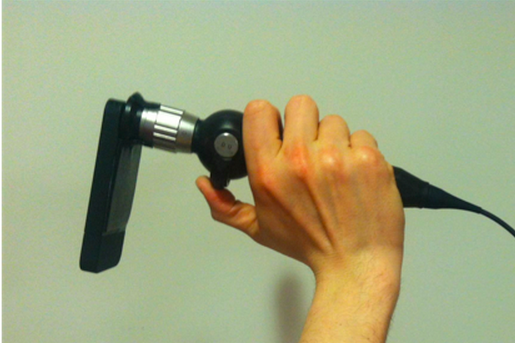
Dr. Paskhover imagined an easier way to visualize the results of a laryngoscope examination. By using his Phone camera and an app called Luma to produce higher quality video and pictures, he could see the results anywhere. To start with, he created a makeshift attachment to secure a laryngoscope to his iPhone case. But ideally, he imagined a more robust solution for his work in rural settings outside the U.S.

Dr. Paskhover's make-shift  attachment for his iPhone 4 case

Dr. Paskhover’s make-shift attachment for his iPhone 4 case

Design
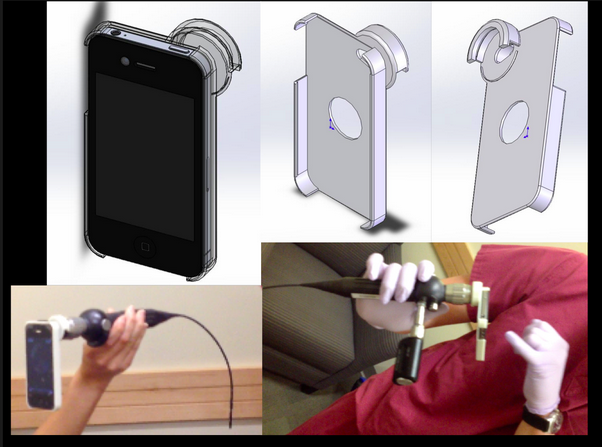
He worked with Sara Pitcairn, TechChange’s Co-Director of Instructional Design, during her senior year at Yale University to bring his idea to life. Through an iterative, human-centered design process, Sara modeled, prototyped and 3D printed an iPhone case with an interface aligning the eyepiece of a laryngoscope with an iPhone camera. The iphone case allowed Dr. Paskhover to capture high-quality photos and videos of his exams with patients without the need for an endoscopic tower.

Designing and testing the 3D printed iPhone case

3D Print

See the 3D printed iPhone case in action:

This is one of many examples of how 3D printing is helping fill gaps that exist in healthcare. There are countless applications in other fields, and especially in disaster response and international development.

Do you have other examples of how 3D printing is being used in your communities? Share them with us in the comments section or tweet at us @TechChange

If you are are interested in learning more about the potential 3D printing offers in your field, join Sara in our upcoming course on 3D Printing for Social Good. We will look at applications of 3D printing in a variety of contexts, along with the challenges and opportunities as the field continues to advance. After the four weeks of the course, you will have a solid understanding of 3D printing so that you can see its potential for your field of practice. We will look at case studies and examples of where 3D printing is being used today and will help you find a maker community, as well as connect you with experts using 3D printing for social good.

The course begins on May 4, we hope you can join us!

What does humanitarian response look like today? With so much information available, how can we use big data effectively for humanitarian efforts?

Joins us on May 5 for a free webinar with Patrick Meier to chat about his new book, “Digital Humanitarians: How Big Data is Changing Humanitarian Response.” Join the conversation and hear Patrick’s insights on his latest book.

May 5, 2015 at 10:00 – 11:00 am EST

Patrick Meier

Patrick is an internationally recognized thought-leader on humanitarian technology and innovation. He directs QCRI’s Social Innovation Program where he develops “Next Generation Humanitarian Technologies” in partnership with international humanitarian organizations. His new book “Digital Humanitarians” has already been endorsed by Harvard, MIT, Stanford, Oxford, UN, World Bank and the Red Cross.

Patrick also founded/co-founded CrisisMappers, Digital Humanitarians, MicroMappers, Humanitarian UAV Network and the award-winning Standby Task Force. He has a PhD from The Fletcher School, Pre-Doc from Stanford and an MA from Columbia. His work has appeared in the New York Times, Washington Post, CNN, BBC, Forbes, Times, Wired and Mashable. Patrick’s influential blog iRevolutions has received over 1.5 million hits. He tweets at @patrickmeier.

Watch Patrick’s TEDx Talk: Changing The World, One Map At a Time.

We hope you will join the conversation on May 5. Sign up now!

Wondered who designs and teaches our online courses? You met one of our course facilitators Kendra Keith in a previous post, and today we introduce you to Norman Shamas.

As TechChange’s Director of Curriculum and Pedagogy, Norman brings his passion for education to designing online courses. Norman facilitates our popular online course on Technology for Monitoring and Evaluation and will be co-facilitating our newest course on Technology for Data Visualization this summer. He also facilitated our previous Mapping for International Development course and our customized course on Technology for International Development for IREX.

Norman has quickly become a thought leader in the field of technology for social good. He was recently invited to be part of the review committee for the Development Impact Lab’s Spring Innovate Grant. Additionally, he is also helping lead important conversations on gender and digital security and bringing important techniques and technologies from data science into conversations around monitoring and evaluation.

Before joining TechChange last year, Norman was at Creative Associates International where he developed an internship program. He completed his graduate studies at the University of Minnesota (where he was a graduate student instructor) and undergraduate studies at Arizona State University.

Join Norman in his upcoming Tech for M&E online course that begins Monday, April 20!

By Samita Thapa and Kendra Keith

When we interviewed Nobel Peace Prize winner, Muhammad Yunus, at the 2013 mHealth Summit, he said that mobile phones are the “Aladdin’s lamp for healthcare”, a statement that still rings true today. Two years after that interview, we take a look at how digital health is beginning to expand beyond mobile phones. Mobile phones – especially smartphones – have been revolutionary in health care, especially in developing countries. With budding industries like add-ons to smartphones and wearable tech, the mHealth landscape is evolving.

Here are 5 digital health tools that extend beyond the mobile phone:

1. Pre cancer screening phone attachment

OscanPhoto source: Cellphone Beat

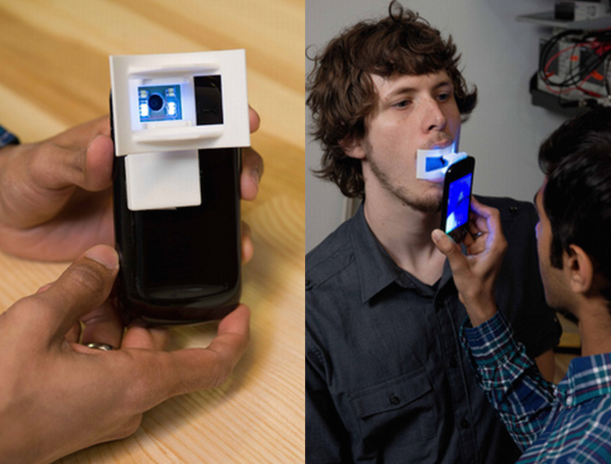
In areas of the world with high amounts of tobacco consumption and limited access to affordable dental care, oral cancer is a major concern. Oral cancer can be prevented with early detection and to equip rural health workers, the OScan team at Stanford university has developed a screening tool that mounts on a camera phone and conducts screenings for oral lesions. The data can then be transmitted to dentists and oral surgeons for assessment. OScan is in the process of conducting field tests with grants from Stanford, Vodafone Americas Foundation, and previously received funding from the mHealth Alliance.

2. STD testing smartphone attachment

Columbia University researchers have created a dongle (an attachment with a specific software) that can plug into Androids or iPhones and conduct tests for HIV and syphilis in about 15 minutes. The attachment costs $34 to manufacture, unlike the current method of conducting these tests in labs which can cost nearly $18,000. The dongle was recently tested in Rwanda on 96 patients and is still under development to improve its accuracy before doing a bigger trial run.

3. Ultrasound attachment for smartphones

Photo source: MobiSante

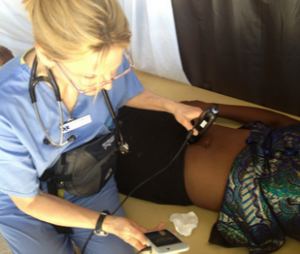
Seeing how an infant is developing during pregnancy allows any dangers to mother and baby to be addressed at an early stage, and is important to reducing mortalities related to pregnancy and birth. Urban hospitals may be equipped to provide ultrasound services to pregnant women, but it is difficult to extend these services to rural communities. To make ultrasound imaging accessible to everyone, MobiSante, Inc, an imaging technology company has developed a “smartphone based ultrasound device that allows health workers to perform ultrasounds anywhere and share the images via secure Wi-Fi, cellular networks, or USB.” With this attachment, the benefits of ultrasound services can be put in the hands of community health workers in even the most remote clinics.

4. Sensory patch for remote patient monitoring

Wendy Taylor with Smart band-aidPhoto source: Mashable

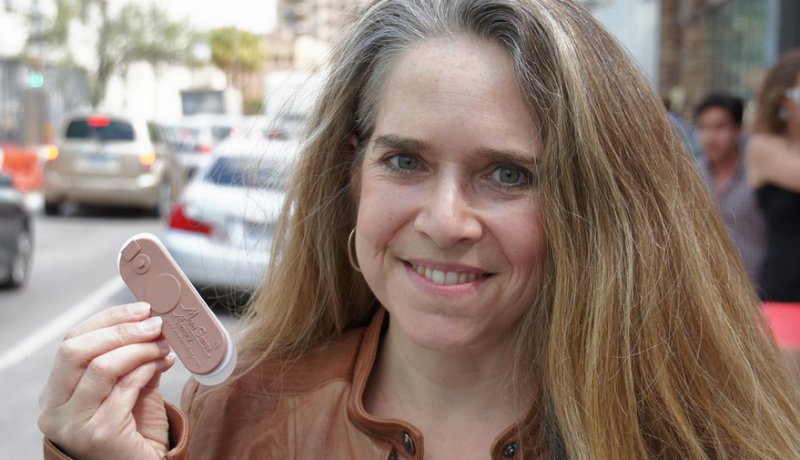
USAID recently launched the ‘Grand Challenge’ calling for innovative approaches in the fight against the ongoing Ebola crisis. One of the two innovations unveiled at SXSW ‘15 is the multisense memory patch or Smart Band-Aid. It’s a flexible patch that takes a patient’s baseline vitals and measures the changes from the baseline remotely. The vitals can be measured from outside the hot zone, or area containing active ebola cases, as the patch uses a USB cable to transmit data (the final version will use Bluetooth). With 7 – 10 hours of battery life, it costs $100 and is disposable. Wendy Taylor, Director of the USAID Center for Accelerating Innovation (pictured above), calls the smart band-aid a game changer!

5. Data Collection Necklace for Infant Vaccinations

Khushi BabyPhoto source: Khushi Baby

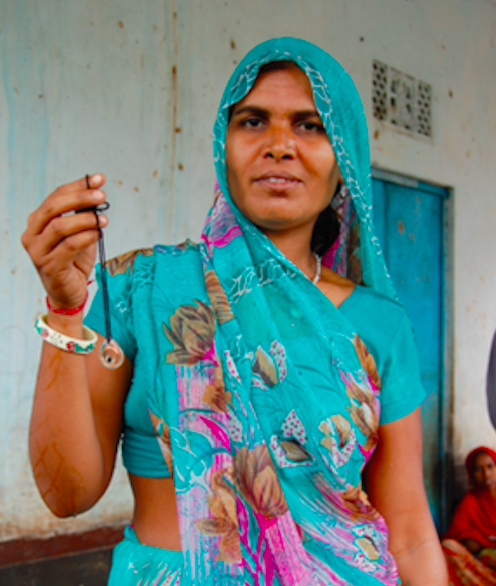
Developed to address the challenge rural clinicians and parents face in documenting children’s vaccination records, Khushi Baby stores children’s medical history in a digital necklace. After winning the Thorne Prize for Social Innovation in Health in 2014, this Yale University classroom project has become an organization and has conducted a successful field test in the village of Mada Daag, India. When vaccinations are administered, the healthcare worker can scan the necklace with their Khushi Baby app on their smartphone to transfer vaccination data to the necklace. The data is also automatically uploaded to the cloud once the healthcare worker returns to the clinic. Parents then receive automatic voice calls reminding them about vaccination clinics and during their next visit, the healthcare worker simply scans the necklace of the baby to see which vaccines are due.

As amazing as mobile phones and these new attachments and wearables are in global health, these new technologies also raise important issues. For example, when it comes to wearables, battery life can be an issue. Erica Kochi, a senior advisor at UNICEF noted that internet connectivity has beat electricity to many rural parts of the world, so access to electricity may still be minimal or non-existent in parts of the world where wearable tech can help. While finding better ways to collect more data is vital in healthcare, data privacy and security is increasingly becoming an important concern as we are realizing that there is too much data to manage.

The overall issue of practicality is another concern. Are these innovative solutions practical, cost-effective, and cost-saving? These are the conversations we will be having in our upcoming mHealth online course. We will be discussing new mHealth approaches like the ones mentioned in this post among others. We have a great group enrolled already and will be hearing from guest experts from organizations like Medic Mobile, National Institutes of Health (NIH), D-Tree International, PATH, and more!

According to a recent report by Grand View Research, Inc., the global market for the mHealth (mobile health) industry will reach $42.12 billion dollars by year 2020. That same year, GSMA estimates that smartphone connections will reach 6 billion, fuelled by growth in the developing world and mobile broadband expansion. The mobile phone market, the largest and most profitable segment of the global device market, is expected to total 1.9 billion units in 2015 alone.

With these high expectations for mHealth and smartphone adoption, what are the biggest opportunities for this $42.12 billion market?

We discussed this topic when we held a panel discussion in partnership with General Assembly DC at their office in Washington, DC in November 2014. In a rare opportunity to combine both “healthies” and “techies” in one room, we gathered a panel including Arthur Sabintsev, lead mobile architect at ID.me and instructor of General Assembly DC’s Mobile Development classes and workshops; Jessica Taaffe, global health and science consultant and writer at the World Bank; and our own Kendra Keith, mobile health specialist; and TechChange CEO Nick Martin – both of whom have facilitated our popular online course on mHealth. During this hour-long panel, we discussed a wide variety of topics on the mobile applications for public health.

Here are some of the highlights of “Mobile Development for Public Health” panel where the panelists shared insights that still ring true across the $42.12 billion dollar mHealth space.

1. mHealth can strengthen health systems

The need to strengthen health systems are the biggest challenges for public health, according to Jessica and Kendra, both of whom hold graduate degrees in microbiology and public health, respectively.

“The greatest opportunities for mHealth field and mobile developers focused on public health are in the public health sector, said Jessica. “The biggest public health issues are governance and figuring out the roles needed to fight infectious diseases and non-communicable diseases that are on the rise, especially as people are living longer.”

There are already several great examples of mHealth apps and programs that are strengthening health systems, including MAMA, MedAfrica, Dimagi, CommCare, and others.

2. mHealth can allow healthcare services to reach more people across the world

The ubiquity and diversity of mobile phones and their global usage will be a key driver of the mHealth industry reaching up to tens of billions of dollars, especially as GSMA estimates that there will be one billion unique mobile subscribers by 2020.

In their experience teaching the one of TechChange’s most popular online courses on mHealth, Nick and Kendra discussed the unique challenges of mHealth outside developed countries.

“Pay-as-you-go mobile phones are the most prominent form of mobiles in developing countries,” said Nick. “This model makes it more affordable for people to get internet access, and it will only get cheaper especially as players like Facebook and Google are ambitiously trying to get the entire world online.”

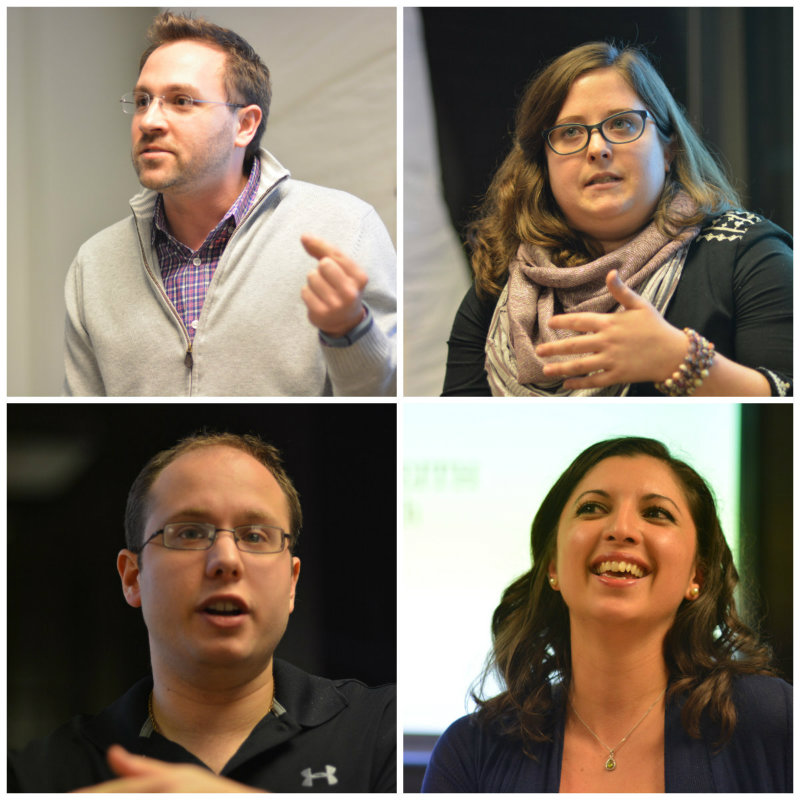
Clockwise from the top-left: TechChange CEO Nick Martin, mobile developer and General Assembly instructor Arthur Sabintsev, global health expert Jessica Taafe, and TechChange mobile specialist Kendra Keith.

Clockwise from the top-left: TechChange CEO Nick Martin, mobile developer and General Assembly instructor Arthur Sabintsev, global health expert Jessica Taafe, and TechChange mobile specialist Kendra Keith.

3. Mobile development for health will become a hotter space for mobile developers through 2020

As a former nuclear scientist turned mobile developer himself, Arthur stressed how there are never enough mobile developers to meet demand in the current global market, much less the global mHealth market. Across the panel, everyone agreed that is it not easy to become a mobile developer, and to keep up with the quickly-evolving skill set demanded for building modern apps.

“Why aren’t there more developers building mHealth apps? Because it’s hard and time-consuming,” said Arthur. “There’s simply not enough time in a day to keep up with all the different standards for different operating systems, as well as all of their respective constant software updates. Although Android phones are used more in the developing world than iOS in western societies, there is a huge problem of Android fragmentation. What you tend to see more of now is that jobs in mobile development are mostly in the finance and advertising industries. If mHealth is truly going to grow to be worth $42.12 billion dollars, I’m excited to see more mobile dev jobs and incentives for this space to grow.”

So how do you incentivize mobile developers to build more mHealth apps for public health?

Nick mentioned that doing so will not be easy, given that mHealth/public health initiatives are often funded by governments or foundations that have procurement cycles. Though there are some initiatives such as the IBM Watson Venture Fund that has contributed to companies such as WellTok, funding long-term mHealth development has proven tough to sustain so far.

Another opportunity for mHealth will be in protecting the data collected in mHealth apps and programs. mHealth is fraught with mobile data security concerns in places where privacy policies are both well-established or barely existent.

What opportunities do you see for the growing mHealth global market? Let us know in the comments below, or tweet us @TechChange.

If you’re interested in learning more about the opportunities for mHealth, sign up now for our mHealth online course! The next round begins this Monday, 30 March 2015.

By: Carolyn Moore and Lesley-Anne Long
Photo credit: Moses Khanu

Since the launch of the first free Training Health Workers for Ebola webinar series in October 2014, we have seen hundreds of members of the global health community come together to share vital, timely information to save lives and prevent the spread of the disease. This real-time and archived delivery of information has been critical to the continued response. We are excited to be working with partners, IntraHealth International, Ebola Alert, and TechChange, to continue growing this community as the response continues and countries begin to rebuild from the outbreak.

A team of organizations, led by mPowering Frontline Health Workers and IntraHealth International, are coming together to share tools and information on how to support health workers responding to and rebuilding from the Ebola crisis.

Please join us in a three-part webinar series beginning April 1.

Health workers in West Africa have been responding to Ebola since 2013, and, according to the latest WHO situation report, the pace of the outbreak is beginning to decline. This calls for relief and celebration. However, this is far from final for those who have been affected by Ebola.

The virus has left indelible marks on their lives, and their stories are many and severe:

The Ebola situation is once more improving in terms of infection rate, but the socio-economic needs are enormous.” (Moses Khanu, Pastor, Sierra Leone)

What comes next for Guinea, Liberia and Sierra Leone, the three most affected countries? And how can countries nearby and in the region plan for future potentially deadly outbreaks?

Health workers remain at the center of community response and support. At the same time, the governments and international organizations that support health workers are seeking answers for how they can restore health services in West Africa, strengthen health systems, and prepare for future health emergencies.

What’s next for Ebola affected countries?
Many organizations are working closely with all actors across the health sector. In our second series of Training Health Workers for Ebola webinars in April, we will have a group of colleagues who have been working in the affected countries talking about lessons learned and planning for rebuilding and strengthening health systems.

We invite you to join the discussion in the webinars.

Reviewing lessons learned, and looking ahead
These webinars will focus on tools and strategies that health workers, as well as the governments and organizations that support them, can use to continue the response, protect their communities and help rebuild health systems. Free training and information resources are concurrently being posted in the Ebola Resource Center http://www.hrhebolaresources.org/

Please join us in the webinars! Here are the details:

Webinar Schedule:
April 1: Working with Youth, Volunteers, and Vulnerable Populations
April 8: Community Mobilization and Preparedness Planning
April 15: Effective Use of Data

All live sessions will be held from 10.00 – 11.00am EDT.

These webinars will bring together more than 15 international health organizations, led by mPowering Frontline Health Workers and IntraHealth International.

Registration and more information are available here. The webinars are open to all, and will build upon the presentations and discussion in the first Training Health Workers for Ebola series.

All of the webinars will be available for viewing at www.techchange.org after the air dates.

The webinar series has been made possible by the generous support of the USAID-supported Health Communication Capacity Collaborative.

Last week, tens of thousands of participants and over 2,000 exhibitors gathered at the annual Mobile World Congress (MWC) in Barcelona to launch and share the latest advances in mobile technology, wearables, virtual reality, gadgets, robotics, the Internet of Things (IoT), devices, 5G, and more.

Similar to last year, we decided to take a look at how announcements from MWC15 will impact the developing world.

1. Facebook and Google continue to spearhead ambitious initiatives to get more people across the world online.

As we shared last year, Facebook and Google continue to lead in efforts to get the next billion people around the world online.

In his keynote address, Facebook CEO Mark Zuckerberg advocated for free basic internet services to propel mobile growth in emerging markets. Since launching Internet.org at last year’s MWC, the initiative has now reached Colombia, India, Zambia, Kenya, Tanzania, and Ghana.

Separately, Google has been experimenting with several initiatives in its connectivity strategy, including Project Loon or “floating cell towers” project, Google Fiber, and Project Titan – its drone extension of Project Loon.

Google Loon Project

Google Loon Project

Photo credit: SiliconKarne

2. Digital identity and privacy is becoming more significant for mobile consumers

When addressing the audience, GSMA Director General Anne Bouverot discussed the growing importance of digital identity.

“I think digital identity is the new frontier. This is an area where we think we need better services to access services: healthcare, payments, social networks, whatever we’re accessing on the Internet. We want to access them and prove who we are, but we don’t want to necessarily give our mobile numbers and be spammed after that. We haven’t completely found this balance yet, so stay tuned for deployment in mobile connectivity and digital identity in the year to come.” – Anne Bouverot

With mobile security concerns on the rise, this year’s Mobile World Congress also introduced smartphones with privacy in mind. For example, Brazilian phone maker Sikur introduced the GranitePhone which has encryption features designed to ease the privacy concerns of smartphone users.

Sikur GranitePhone

Sikur GranitePhone

Photo credit: Cnet

3. mHealth focus shifting to wearables
Wearable technology was a hot trend at MWC15, especially in the form of fitness trackers, smartwatches, and smartbands. For example, HTC made its big launch of the HTC Grip in partnership with Under Armour and featuring built-in GPS capabilities.

What’s ahead?

Though MWC15 covered many types of emerging technologies beyond mobile including 5G, connected devices, the internet of things, virtual reality, and other topics, the theme of the immense potential of the world’s connectivity resonated throughout the week.

According to Jimmy Wales, Founder of Wikipedia, who attend this year’s Mobile World Congress,

Technology is making real and useable internet access available to tens of millions across Africa today and if we think forward 20 years and even 10 years, we’re going to have massive connectivity to the real internet for hundreds of millions of people and this going to have an incredible impact on politics in these places, on society, on trade, and opportunities for all kinds of people.” – Jimmy Wales

What news on MWC15’s impact on developing countries did we miss? Let us know in the comments and/or tweet us @TechChange.

Interested in how MWC15 announcements are impacting Mobiles for International Development and mHealth? Register for these courses now!

In June 2014, we wrapped up the second round of our Mapping for International Development online course. Nearly 60 participants joined us from Rwanda, Ethiopia, Benin, Mozambique, Australia, Kenya, Haiti, Thailand, France and 10 more countries. They represented organizations like Oxfam, Korea NGO Council for Overseas Development, Chemonics, Danish Demining Group, Abt Associates, and many more.

Before we start our next Mapping for International Development online course on Monday, we took a look back at the previous round of the course. Here are a few things we learned together:

1. Learning to create a map is much more than learning about mapping tools

In this mapping course, the participants were introduced to mapping tools beyond just Google Maps Engine, like Tomnod, Crowdmap, OpenStreetMap, and many more. But before diving into the tools, we kicked off our mapping course with a lively discussion on an ongoing debate about the power of amateur cartographers in telling their story by mapping their own communities.

In a course with various levels of mapping experience, this discussion was definitely a highlight of the course. Tom Mueller, a GIS professor at California University of Pennsylvania, pointed out in the course that “all maps are telling a story.” And the discussions in this first week made clear the participants’ view that the communities being mapped should have the power to tell their own story, whether it means creating their own maps or choosing not to be on a map.

Some of the participants were being introduced to thinking about the ethics of mapping for the first time through this mapping course. Participants grappled with questions like who is or is not represented on a map, is a map biased, what story is a map telling, who made the map and why.

Mapping for International Development was much more than a class on how to use different mapping tools (for that, there are already many tutorials available online) but rather an excellent overview of the current debates regarding mapping for international development and current ongoing experiences.Fabien Maitre-Muhl, who works in the Community Violence Reduction section of UN Stabilization Mission in Haiti

2. The best maps require collaboration

Like the global digital mapping community, the participants and guest experts learned from each other in this mapping course. Nine guest experts joined us from OpenStreetMap, Tomnod, Ushahidi, GIS Corps and other organizations that crowdsource the talent of mapping volunteers to create better maps. The active engagement of almost 60 participants amongst each other and the guest experts made the four weeks of the course a great learning experience for everyone.

After the first week, we discussed the different tools used to create maps, and participants had a chance to share the maps they were working on. They were able to see each other’s work and find ways to collaborate and learn from each other’s experience. Tom Mueller’s final project for the course was creating a mapping project for his students where they used social media to map ongoing crises around the world. He created the project by getting feedback and suggestions from the other participants in the Mapping for International Development course.

“Thanks to all the other course participants. There were some really interesting posts in the forums and obviously some fascinating and important development and humanitarian work is going on around the globe. The course certainly raised my awareness about the role that mapping can play in this work, as well as the kinds of barriers and challenges that mappers have to negotiate in a range of social situations.” – Gary Scott at Australia Central Land Council

“I have effectively learned how to create an interactive map using tools such as QGIS and TileMill starting from nothing thanks to this course.” – Mattia Zanazzi at the UN Stabilization Mission in Haiti

3. Mapping makes the invisible visible

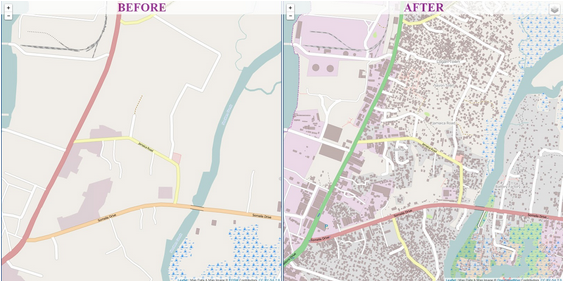
Fabien Maitre-Muhl, one of the course participants noted that, “mapping helps make the invisible visible.” Increasingly, digital mapping is becoming important in expediting humanitarian response as it is crucial to reach the population most affected by crisis in the most remote areas. During the Ebola crisis, OpenStreetMap helped map the affected areas to make tracing the outbreak easier.

Monrovia OSM pre-Ebola

Map of Monrovia in OpenStreetMap before and after volunteers mapped the city in response to the Ebola crisis. (Humanitarian OpenStreetMap)

Mapping can also help visualize the impact of international development projects. Mira Gupta, a TechChange alumna from the previous Mapping course “used election maps to illustrate to [her] research team that once geocoded there might in fact be very distinct geographical trends in the data” for a maternal and neonatal health qualitative study.

The last Mapping for International Development online course introduced the participants to various mapping tools, and more importantly, facilitated engaging conversations among people with varied levels of expertise from all over the world, and helped them get a better sense of the mapping needs and impacts for projects they were working on.

More than two dozen participants from 13 different countries have already enrolled in our upcoming Mapping for International Development online course, representing organizations such as Oxfam, Deloitte, Helen Keller International, United Nations, International IDEA, Vera Solutions, PwC, and more!

You can join us too! Sign up today for our Mapping for International Development online course, that begins Monday, March 2.

How can mapping the geolocations of tweets tell a story about global atrocities? How can digital mapping be integrated as a learning tool for university classes?

As part of his final project for TechChange’s online course, TC141: Mapping for International Development in Spring of 2014, GIS professor Tom Mueller wanted his students to explore these topics. In Professor Mueller’s course, “Introduction to Geography” at the California University of Pennsylvania in Pittsburgh, he had his students look for patterns in social media during humanitarian crises such as Ebola outbreaks and conflict casualties, and visually display the spatiality of those events.

Throughout the semester, Tom held several discussions with his students on various topics using social media to map out crises. In his course’s final assignment, Tom had about 100 students in the geography class work in groups to map various Sudan/South Sudan incidents by following several Twitter handles and categorized tweets. After examining their papers, he decided to ask them to choose a country and possibly use CrisisNet as several students became more concerned about gathering tweets rather than the information itself. He felt students would take more ownership of their projects if they independently selected their country, region or topic of choice. So, he is having them search topics on CrisisNet to understand the information that can be part of a tweet. Subsequently, they will examine some news sources and choose a country, topics, etc.

We sat down with Tom Mueller to learn more about incorporating digital mapping into his university class.

1. What is your background in mapping? What interested you in taking TechChange’s Mapping for International Development class?

I have been a GIS professor at a small school just southeast of Pittsburgh called California University of Pennsylvania. I read about crisis mapping and wanted to learn more. When I read about TechChange’s Mapping for International Development online course, it seemed like a great way to acquire more knowledge.

2. What were the most useful tools that you became familiar with in Mapping for International Development online course? How are you applying what you’ve learned in the class?

The two most important tools I found to be useful were MapBox and CrisisNet. While I encouraged my students to use ArcGIS Online in my course, learning about MapBox and its use cases helped me see the connection. It made me realize that this type of project could work with an introductory class with no GIS experience since all we needed was
latitude and longitude of the location. This may sound silly, but after going through it on MapBox, I thought I can do this in ArcGIS Online.

Now I know I should have realized it before but going through the process let me step back and understand the power this project might have on the students.
Hopefully, they understand the power of location, social media, etc.

The most important aspect of the Mapping for International Development course was the feedback from the global class participants and TechChange instructors. It was their discussions that helped me design the project guidelines to let students follow certain Twitter accounts to gather information and attempt to investigate locations based on those tweets.
All the topics we discussed in the TechChange online course helped me to understand the beginnings of this type of geographical analysis and build my ideas. As I started formulating my ideas, I could put this information on the discussion board and the TechChange course participants would give me their comments, and suggestions or ask questions. All this information allowed me to build my university class project from the ground up for my own students.

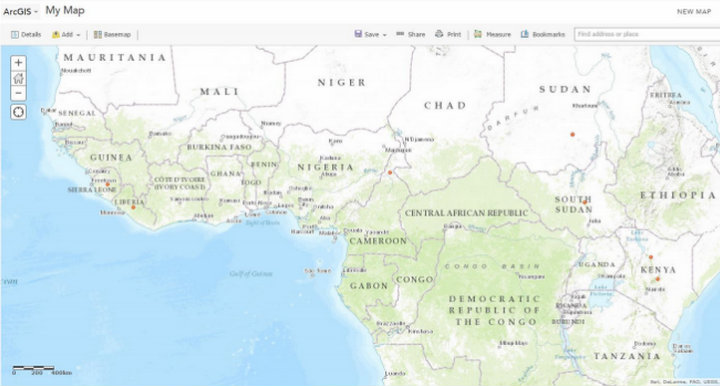
An ArcGIS map produced by one of Tom Mueller’s students indicating the locations of early Ebola incidents.

An ArcGIS map produced by one of Tom Mueller’s students indicating the locations of early Ebola incidents.

3. What inspired you to create this digital mapping exercise for your university students?

In my “Introduction to Geography” class at California University of Pennsylvania in Pittsburgh, my students and I examine geography through a global and regional lens. Sometimes geography might not be the most attractive topic for students, so I needed a hook to pique their interest. Humanitarian issues and genocide seemed to catch the students attention the most. I also knew that the situation in Sudan / South Sudan was active and the students would be able to get a lot more current information from Twitter than other sources.

4. How did your students respond to the digital mapping exercise? What were the results?

My students really enjoyed the assignment as it allowed them to learn about an unfamiliar part (at least to them) of the world. A few students said they could not believe the issues in this area since it did not seem that the popular media was covering the events. If I include a digital mapping exercise again in future classes I teach, my only change would be to may let them choose a developing country and use CrisisNet as their data source. Then they would present their findings to the rest of the class.

5. What is your advice for other professors looking to incorporate digital mapping/blended learning (offline +online) into the courses they offer at universities?

Professors need to be flexible when experimenting with new technology tools in the classroom. For this project, we changed our plans slightly about three times based on conversations with the students and events around the world. The key for my class was not to write a “thesis”; it was for students to understand the power of social media during crises and the spatiality of those events.

About Thomas Mueller

Tom-Mueller

Dr. Thomas R. Mueller is a professor at the Department of Earth Sciences at the California University of Pennsylvania and an alumnus of TechChange’s Mapping for International Development online course. His research agenda has grown dramatically throughout his career at California University of Pennsylvania. He applies spatial theory to the real world, particularly using Geographic Information Systems. His key to building a successful research agenda is to produce work through a variety of scholarly endeavors, including conference presentations, grants, technical reports, book reviews and publications in professional journals. He also has taught numerous GIS workshops for members of the local community, professors at Cal U and other campuses, and for the K-12 community.

Interested in learning different digital mapping tools for the context of humanitarian crises around the world? Enroll now in our upcoming Mapping for International Development online course.

PreMAND field workers testing data collection tablets in Navrongo, Ghana (Photo: N. Smith)

Mira Gupta, one of the star alumna of our courses on Mapping for International Development and Technology for Monitoring & Evaluation (M&E), is a Senior Research Specialist at the University of Michigan Medical School (UMMS). Last October, USAID awarded UMMS $1.44 million to assess maternal and neonatal mortality in northern Ghana. This 36-month project, “Preventing Maternal and Neonatal Mortality in Rural Northern Ghana” (also referred to as PreMAND: Preventing Maternal and Neonatal Deaths) will help USAID, the Ghana Health Service, and the Ghana Ministry of Health design interventions to prevent maternal and neonatal mortality by investigating the social, cultural and behavioral determinants of such deaths across four districts in northern Ghana. For this project, UMMS will be partnering with the Navrongo Health Research Centre and Development Seed.
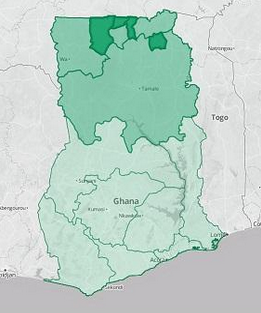
Project Regions and Districts

Project Regions and Districts

We sat down with Mira to learn more about this project and how her TechChange trainings in digital mapping and technology for M&E gave her the skills and background she needed to develop her team’s project in Ghana.

1. What interested you in taking the Mapping for International Development and the Tech for M&E online courses?
I was in the process of trying to learn everything I could about our GIS options when I heard about TechChange’s Mapping for International Development course. It provided a fantastic introduction to the range of approaches being used on international development projects and the variety of organizations working in that space. The course material helped me identify which types of visualizations would be most appropriate for my team’s research. I especially benefited from the many sectors represented in the TechChange sessions because while I was trying to create a project for the Health sector, I actually learn best through a Democracy and Governance framework given my previous background in this field. TechChange provided access to mapping specialists in both areas through its instructors and other class participants.

Just as I heard of the mapping course right as I needed it, the same thing happened again with the Technology for M&E course, which I took a year later. By that point, the PreMAND project had just been awarded and I learned that I would be responsible for the evaluation components. I was excited to take the TechChange course because I knew it would provide a great overview of the many different tools being used, and that I would benefit immensely from the participation of classmates working on projects in similar settings. As expected, the content presented was incredibly valuable in informing our project approach in terms of our field data collection, methods of analysis, and presentation of findings.

2. How did the mapping component of this USAID-funded project come together?

The Three Project Phases: Research will inform the visualisations, which will inform programming

The Three Project Phases: Research will inform the Visualisations, which will inform Programming

While working on a maternal and neonatal health qualitative study a couple of years ago, I sensed that there were themes and patterns in the data that were difficult to verify since the locations of the respondents had not been geocoded. Some of the variables indicated 50/50 probabilities of any particular outcome, which seemed to suggest that there was no pattern whatsoever when viewed as a large dataset. Because my background is in Democracy and Governance, I used election maps to illustrate to my research team that once geocoded there might in fact be very distinct geographical trends in the data, drawing parallels to the locational breakdown of political party support in the United States.

I was in the process of researching mapping resources when I first heard about the TechChange’s Mapping for International Development course, and through the course I met some of the mapping experts that ultimately served as key resources in the development of our project strategy. The course gave me the necessary base knowledge to effectively liaise between our health researchers and the mapping experts to determine the best approach to meet our data visualization needs. We were extremely fortunate to have USAID-Ghana release a call for outside-the-box submissions under its Innovate for Health mechanism, right as we were developing our program concept.

3. What are the biggest challenges you anticipate in undertaking this project?
For the visualization component, generating the base layer maps will be more difficult than we originally anticipated. The various pieces of data we need are spread throughout different government sources such as the Ghana Statistical Service, the Lands Commission, and the Ministry of Roads and Highways. We will need to consult with each of these groups (and likely many others), to explore whether or not they will allow their data to be used by our project. It will require some agility on our part, as we need to stay flexible enough so that we collect any outstanding geographic data we may need through our team of field workers. While there are many moving pieces at the moment, it’s exciting for us to think that we’re building what may be the most comprehensive geographic base layer map of the region, as an initial step in developing our health indicator analysis tool.

There are also a handful of challenges related to evaluation. The primary purpose of our project is to provide new information to clarify the roles of social and cultural factors in determining maternal and neonatal deaths, and shed light on a valuable set of drivers which up until now have been unclear. We are currently in the process of finalizing our M&E framework, which has been a complex process because our project doesn’t fit the mold that most performance indicators are designed for. As a result we’ve been carefully drafting our own custom indicators through which we’ll measure our project’s progress and impact.

One of our most interesting evaluation challenges has been the development of our Environmental Mitigation and Monitoring Plan, which is traditionally intended as a tool for implementing partners to take stock of the impacts their work could have on the natural environment. In our case, we’re using it as a tool to think through our ethical approach to the potential impact of our project on the social and cultural landscape, given the challenges associated with collecting very sensitive health information and the need for data privacy. It’s pushing our team to think through every step of our project from the perspective of our various stakeholders, and has yielded many valuable insights that have strengthened our program approach.

4. What are the tools that you became familiar with in Mapping for International Development and M&E and plan on using in this project and how will you apply them to your project?
I came into Mapping for International Development knowing very little about the resources available in that space. Several of the tools that I became familiar with through the class, such as OpenStreetMap, MapBox and QGIS were highly applicable to our project in Ghana. After participating in the session led by Democracy International and Development Seed, I reached out to those instructors for their input on how I could best translate my project concept into actionable steps.

The visualizations I hoped to create were complex enough that I soon realized it would make the most sense for our research team to work directly with a mapping firm. We were so impressed by the technical feedback and past projects of Development Seed that we established a formal partnership with them and worked together to refine the vision for the project that was ultimately funded. TechChange’s training gave me the knowledge I needed to select the right partner and understand how best to combine our research goals with the available mapping resources to maximize our project’s impact.
Programs used on the PreMAND project

Programs used on the PreMAND project

In Technology for M&E I learned about the capabilities of different devices, survey apps—those able to capture geodata were of particular interest to me—and even project management tools. There were many helpful conversations both in the class sessions as well as in the participant-led threads around the data collection process, data privacy, and the ways in which project findings can be best communicated to a variety of stakeholder groups. What I found to be most relevant and applicable to our Ghana project were the conversations surrounding human-centered design, and the use of rich qualitative data. I gained a lot from the session led by Marc Maxson of GlobalGiving, who discussed which forms of data are the richest and easiest to interpret. The University of Michigan and our partner the Navrongo Health Research Centre already excel in qualitative data collection techniques, but the conversations throughout the TechChange M&E course inspired some new ideas as to how we might incorporate multimedia such as video and photographs in our qualitative data collection process to make our project deliverables that much more substantive.

5. What is your advice for researchers working to integrate more data visualization and mapping in their research and project interventions?
My advice would be to focus on the end user of your data and identify their needs and interests early in the process. That clarity can then be used to inform 1) what content will be most useful, and 2) what presentation format(s) will be most effective. It’s important to do some form of a needs assessment and let stakeholder feedback guide the project’s design.

In the case of our Ghana project, we are implementing a two-prong approach to our visualizations because both the government representatives and our donor will find an interactive web application most useful, while local community members in the rural North will benefit more from group discussions centered around printed maps.
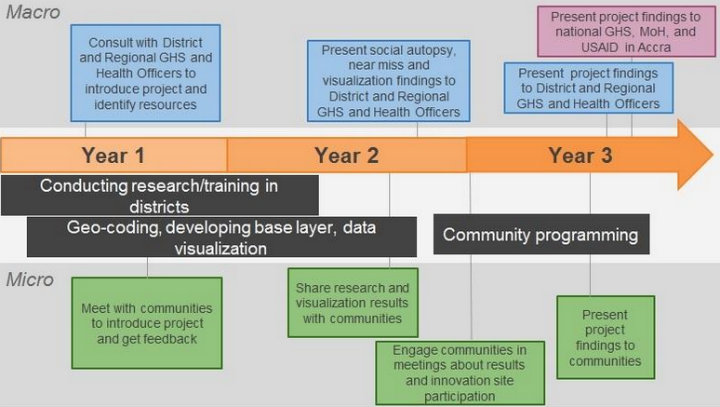
Feedback loop with two stakeholder groups: the government of Ghana and local communities

Feedback loop with two stakeholder groups: the government of Ghana and local communities

It is common to sometimes present health indicator data solely as points on a map, but we are designing our visualizations to be much more detailed with background layers including health facilities, schools, compounds and roads so that those viewing the health indicator data can orient themselves a bit better to the local context. Had our end-users only been the leaders of those individual communities such detailed maps may not have been necessary. Similarly, the visualizations for one stakeholder group might incorporate a lot of words or even narrative stories based on their level of education, while for other stakeholders, those visualizations will be more image-based and we’ll orient them to the maps through presentations in their local communities.

About Mira Gupta

Mira Gupta

Mira Gupta is a Senior Research Specialist at the University of Michigan Medical School (UMMS), where she focuses on program design, strategy and evaluation. She has developed successful international aid projects in 18 countries, including 13 in Africa. Mira began her career in the Democracy and Governance sector where she worked for organizations such as IFES, the National Democratic Institute, and the Carter Center. She also developed projects in the Economic Risk and Conflict Mitigation sectors before transitioning into Global Health. Her research on the effects of local power dynamics on health-seeking behavior in northern Ghana is published the current edition of Global Public Health.