Traditional education in the US has long been required to accommodate those with disabilities through statutes like the Individuals with Disabilities Education Act (IDEA), but online learning has lagged behind. The excitement for improving online access to Ivy League classrooms should extend beyond just connectivity to intentional instructional design. But what standards and guidelines exist?

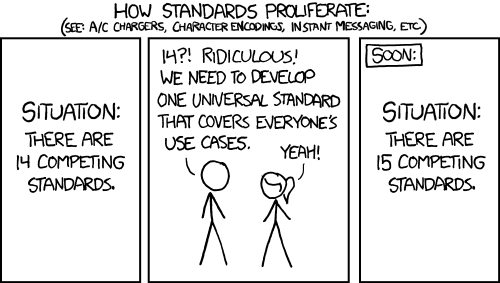
Fortunately, the charging one has been solved now that we've all standardized on mini-usb. Or is it micro-usb?  Shit.

We recently took on the challenge of bringing all of our coursework into compliance with Section 508, a set of regulations which sets technical standards to promote equal access to (among other things) web content and multimedia for populations with disabilities.

Online learning can improve access to information by people with disabilities. Compliance with Section 508 of the Rehabilitation Act isn’t just the right thing to do, it also makes good business sense. But we still have a long way to go.

According to Wikipedia: “Section 508 (29 U.S.C. § 794d), agencies must give disabled employees and members of the public access to information that is comparable to the access available to others.”  These accommodations include things like closed captioning and audio descriptions for multimedia, machine readable design to allow screen readers easy access to and navigation through content, and other methods of ensuring that everyone has the ability to benefit fully from our courses.  Some may say that regulations such as these impose a great cost, and likely help few.  But we think differently, for several reasons.

This is an endeavor we want to be doing anyway, because it’s the right thing to do.

A lot of the courses we do are about inclusion: using technology for democracy, better health, and conversation across traditionally disparate groups.  We are proud to have students from around the world in each of our courses.  Leaving behind those who have difficulty accessing technology would undermine our mission.

It is not difficult if done from the beginning.  

Though including closed captioning or audio description tracks obviously involves more than the bare minimum amount of effort, if included from the beginning, it becomes part of the content generation process, and overhead is low.

It makes us more competitive.

Federal agencies and contractors are required to conform to the 508 standards if compliance is possible.  This includes procurement.  So a compliant product must be chosen over a non-compliant one.

It naturally follows from good design and coding principles as well as web standards.

Good code and good design have a common theme:  they are clean.  Clean design and code is also easier for assistive technology like screen readers to read.  It’s simpler to do things like make text larger if there is plenty of space to do so, avoid using colors to denote meaning since it can’t clash with your color scheme, and leave room for captioning and transcripts in empty space that doesn’t distract other users with unnecessary detail.

Thinking about the challenges of accessing our content helps us make the experience better for all of our students.

Thinking about how to minimize the impact of compliance on your media forces you to think about how you present material, and to present it in different ways that will complement each other.  Not only because different people learn different ways, but also because reinforcement through a different mode is still repetition, the most effective form of learning.

Thankfully, the 508 Standards are fairly straightforward.  Indeed, they involve a careful analysis of the problem and what solutions work, which is a long and arduous process we are ill equipped to duplicate.

What isn’t straightforward ways to test your product and underlying platforms for actual usability.  The next couple of posts on accessibility will talk about some of the more troublesome edge cases in 508, our process to make all of our content as accessible as possible, and how future standards and technologies can continue to make learning inclusive.

What processes do your organization use to expand access to your services?

Big data is already giving us better TV shows. Could it also help build a better education system?

This week our team went to 1776 Reboot: Education Meetup, where we heard from leading experts from Coursera talk about the future of online MOOCs, as well as entrepreneurs from TechStars about applying an accelerator approach to learning. But one of the real stars of the night was Richard Culatta of the Department of Education, who declared that we now have more data about what kids watch on Netflix than how they learn in school.

So what?

When Netflix rolled out House of Cards as all 13 episodes developed on metrics learned over the years from their watchers, Kevin Spacey stated in a Business Insider article:

“It’s a real opportunity for the film and television industry to learn the lesson the music industry didn’t learn. Give the audience what they want, when they want it, in the form they want it in, at a reasonable price, and they’ll buy it.”

In our last post, Four Reasons Why Universities Aren’t Ready to Move Online, we looked at how universities need to invest more heavily in producing compelling online content — not just videotaping professors lecturing. The dirty secret behind online all of the education platforms that are generating the creative chaos around online education is that they are not providing an online education at all, but rather educational content in a structured format. If that’s the case, what can online education learn from the current revolution in content distribution?

In criticizing current approaches to online learning, we often refer to the “Netflix” approach to online education — passive consumption of videos instead of interactive back-and-forth learning. But there’s no doubt that there is a market for passive consumption of educational videos, ranging from the current gold standard of Lynda.com to simply looking up a how-to screencast on YouTube.

  • Piecemeal Content (Amazon). Amazon is a retail company, that wants to also sell digital content. Think of this as purchasing and streaming an episode of Ken Burns Civil War. But are customers willing to buy educational content when there has been hesitation to do so for TV (hence the existence of PBS).

  • Free Prosumer (YouTube). YouTube is a Google product that wants to build general user data. The problem here for users is discovery and quality control — it’s hard to find quality, and it’s hard to find programs of study as opposed to small snippets of knowledge.

  • Freemium Model (Hulu). Hulu is an ad-supported subscription video service, that wants to build interest in existing broadcast content. It’s also perhaps the closest to the existing Coursera and EdX model. While the education is free, they are looking at “freemium” educational models where they can charge for certificates of completion or credit.

  • Premium Distribution Model (HBO). This could be TED talks right now, although those are free — TED controls the vertical by organizing the conferences, filming the speakers, and then distributing on their own platform. The content is often superb, but–like HBO–is restricted in it’s theme and format. HBO is a cable company that happens to be online.

  • Content Buffet + Original Content (Netflix).  Netflix provides on-demand Internet video streaming. Most interestingly, they then used big data from how their users watch other media to figure out how best to deliver its own content.  There’s not a perfect comparison yet, but there are some indicators of what’s to come.

Khan Academy started off with simple YouTube videos of basic skills.  Since then, they have aggregated them into groups with clear skill progression and then allows students to practice with post video problems, which give them an enormous amount of feedback on how well students are learning.  This data not only helps students learn through application of knowledge to problems with instant response, but easily enables Khan to present additional problems to support or remediate weak areas.  And all that data can show Khan how to make an even better experience by combining it with theories on effective learning.

Big Data companies like Hortonworks are trumpeting data-driven education, while new startups like Clever and learnsprout are helping developers get in touch with new sources of data on achievement and teaching.  Even government is getting in on the game.  Led by the Department of Education’s Richard Culatta and the administration’s general open data philosophy, every metric available is being drafted to the use of improving education across the country.  But the metric gathering potential of online learning is even greater.

Brace yourselves: We may be about to see some of the best educational content of all time built on metrics that traditional educators could only dream about. And moreover, since this isn’t just about producing content one time for one show, but for topics that will require constant updating and modification for improvements.

What will your courses look like when your professors are actually producing quality content and A/B testing the heck out of it? When they improve not semester to semester, but week to week?

This post was co-authored with Mike Brown.

Co-authored by Mike Brown.

The future of higher education may be online, but the present is still a mess.

The New Yorker recently published a thorough exploration of MOOCs and higher education. Coincidentally, this piece came out as the same week that my alma mater announced it had failed to fill about a third of its incoming freshman class. Whether a temporary enrollment misfire or permanent disruption of the education system, both the struggles of terrestrial universities and the potential for an online future raise important concerns about how higher education will survive.

Although perhaps not the author’s intention, the article revealed five key differences between traditional teaching institutions moving traditional courses online and courses designed to be online from the very beginning:

No experience in producing online content. The main video editor for Nagy’s course is a graduate assistant who recently defended her dissertation in Greek history, not a Web editor by vocation. Good educational content requires audio, video, graphics, and subject matter to work in unison. Universities are buying platforms like marble mansions and filling them with cardboard content.  But live teaching is hard, which is why good lecturers are hard to come by.  The same applies to other modes of delivery, and with MOOCs, the potential efficacy lost from skimping on the experience will scale with the course, growing linearly, while the cost of getting it right from the beginning is fixed, getting cheaper per person as number of students scale.

No clear teaching or evaluation model. This is still the “let a thousand flowers bloom” stage of online learning, but that has to end eventually. While it was good to see the back-and-forth on the socratic method, without methods of evaluating work, it seems premature to congratulate education on cracking this nut. Multiple-choice quizzes to test reading comprehension will never replace essays, and machines are a long way off from being able to grade 31,000 essays accurately.  But besides peer grading, which is successfully used by Coursera and the Comprehensive Test Ban Treaty Organization’s “Around the Globe and Around the Clock: The Science and Technology of the CTBT,” we don’t have better ways of evaluating student progress in depth, as well as breadth.  New models and tools are needed for these subjects.

No clear business model.  It initially seemed unnecessary to take a trip and cameraman to Greece as part of the budget for this course, but if students are willing pay for that authentic experience, then why not?  It may well be that including such edutainment content as shots from the real places, much like the history channel used to do, will benefit students greatly;  what’s most important is that they track how it changes how students engage, and perform further experiments to validate these theories.

No access to social networks.  Perhaps the most telling part of the article was the admonition of universities not just as delivering elite education, but connecting elites with one another into lifelong networks. Emphasis on admonition.  Not only is more data available to mine when students interact in social network type settings, but students and teachers benefit from the collaborative and iterative experience inherent in group-based contemporaneous learning.

Traditional universities are, in the words of the article, standing in front of an avalanche. They are understandably attached to their current model, which they have developed over centuries, but it leaves them vulnerable to the scale-free model of online learning. The prospect of a global audience and substantial cost savings from online coursework is attractive. However, they are poorly positioned to benefit from either without revolutionizing their entire approach.  Universities, in this new age, are facing the classic Shumpeterian forces of creative destruction.  Much like the railroads, which once dominated transport, innovation is placing pressure on their model, and if they remain attached to a model displaced by innovation, they will be destroyed by it.

Are there more ways that universities are failing to keep up with the times?  Are products of e-learning startups falling too far from the educational tree?  Join the conversation in the comments.

The following is a guest post by Christian Douglass, a TechChange alumni from TC104: Digital Organizing and Open Government

What makes the Open Government Partnership – seemingly another multilateral good governance initiative — worth watching?

It’s not because it’s grown from eight to fifty-eight countries in under two years. That’s fast, and fifty-eight is a respectable number – it demonstrates momentum – but plenty of multilaterals, like the Community of Democracies, reach that number early on.

The Open Government Partnership (OGP) is President Obama’s international expression of his pledge to make his administration the most transparent in U.S. History: In November 2012, after a trip to all-the-reform-rage country of Burma, President Obama secured a commitment from the once international pariah to work towards OGP eligibility by 2016. Time will tell if the cadre of former generals will meet that tall order, but they have showed a willingness to try. The international community, including the U.S., is bending over backwards to help.

President Obama also made the OGP a top-line message in a recent Oval office visit by four African heads of state. As a carrot for being democratically elected governments, Cape Verde, Malawi, Sierra Leone, and Senegal were invited to the U.S. in March. Those that were OGP eligible, such as Cape Verde and Malawi, committed to join. Sierra Leone pledged to work towards eligibility. A rule of thumb: If the President mentions anything twice, the bureaucracy takes notice. As a result of the visit, don’t expect OGP to be taken out of talking points until the next election cycle.

But there are two really good reasons to watch the OGP:

First, the role of civil society. One of three co-chairs is a CSO, as well has half of the 18-member steering committee. Additionally, countries are required to form, track, and review commitments in conjunction with civil society during the action plan lifecycle. Governments have to develop commitments in conjunction with local civil society stakeholders, as well consult with the OGP steering committee before finalizing their commitments. This is no panacea, but it represents a very significant opportunity for civil society.

Secondly, the OGP is action –not talk – driven: the first eight country self-assessment reports on action plans are being publically published in the next several months. An independent third-party will review the progress of the action plans and publish their findings by October. Thus, 2013 is a big year for the OGP. If it is too maintain momentum and solidify legitimacy, the independent assessment process has to produce credible reports of each country’s accomplishments for public review.

And here is why the OGP might be different: Countries develop their open governance projects, as long as they fall within the parameters of the OGP five “grand challenges” that focus on the four OGP principles: Transparency, Citizen Participation, Accountability, and Technological Innovation.

For example, as a part of their OGP commitment, Mongolia recently announced they have instituted electronic balloting, removing another opportunity for voting officials to influence the outcome – which can slowly build trust in governing institutions. Brazil recently instituted “clean slate” laws: No official may have a criminal record. This may sound baseline and intuitive, but after the law was passed it was revealed that many officials had records.

Each country designs and owns which handful of projects they launch. In this way, the good governance accomplishments of OGP partner countries might be like the tenure of former Secretary of State Clinton.

Secretary Clinton did not choose one big “legacy” accomplishment, like advancing Middle East peace. Instead, like a good venture capitalist, the State Department, under her guidance, seeded projects around the globe as diverse as promoting better cook stoves in Asia to battling human trafficking in India. She had her theme of “economic statecraft,” but what that meant in each country was context specific.

The Open Government Partnership, if it is to be deemed successful, may be measured in that same way: A thousand local good governance developments all adding up to something big and continuous. In that way, it is very much an initiative for the Internet Age, where a thousand voices in Egypt can start something that can’t be bottled up.

Our mHealth: Mobile Phones for Public Health Online Certificate course will run for its second time from June 3rd – 28th and we couldn’t be more excited about it. Along with The mHealth Alliance, we have had six months to reflect on course feedback and refine curriculum to make sure we are offering the most comprehensive and enjoyable online instruction possible.

mHealth101 Twitterchat (1)

Twitter Chat Contest:

Want to win a free seat? Then join us for a Twitter chat using #mHealth101 on Thursday, May 17th at 2 pm EDT to be entered in a random drawing! @Techchange and@mHealthAlliance will be co-hosting the event and will be discussing course curriculum, mHealth trends, and case studies. More details to come but tweet at @TechChange or @mHealthAlliance if you have questions and we look forward to having you join us!

What is the Course Structure?

Students will have the opportunity to engage directly with leading applications developers, and learn from practitioners who have had significant experience in implementing mobile phone based communication systems around the globe.

The entire course is delivered online. The total time commitment is a minimum of 2-5 hours a week. The course is designed to be highly interactive and social, but we also work hard to ensure that the majority of the content can be experienced in a self-paced manner. It will feature one or two real-time interactions each week, such as live discussions, live expert interviews, and live simulations. In order to accommodate busy schedules of mission staff from around the world, we’ve set up a learning environment where participants have plenty of options to explore content that is most relevant to them through live content and interactions, readings, and videos.

Facilitators will produce weekly audio podcast recaps for participants to catch up on key conversations and topics. Participants can also access all course content six months after course completion so the material can be revisited later.

Schedule:

●   Week 1: Introduction to Mobile Health

●   Week 2: Strengthening Health Systems

●   Week 3: Moving Towards Citizen-Centered Health

●   Week 4: Large Scale Demonstration Projects


For even more information about the course, visit the course page or take a look at the syllabus. To make sure you get a seat, fill out an application here and get enrolled.


This past Thursday and Friday (May 8 & 9) I participated in the ICTs and Violence Prevention workshop hosted by the World Bank’s Social Development Office.  We had an excellent collection of experts from across academia, NGOs, and government who discussed the complexities of using technology for violence prevention.  One of the key takeaways from the event was the analytic challenge of identifying where violence was likely to happen and how to encourage rapid response.

The problem of preventing violence centers of two things; predicting where violence will occur and the ability for institutions to respond.  Emmanuel Letouze, Patrick Meier and Patrick Vinck lay this problem out in their chapter on big data in the recent IPI/UDNP/USAID publication on ICTs for violence prevention.  They point out that instead of using big data to aid interventions by large institutions, that big data can be analyzed and packaged so that local actors can use it to respond immediately when they see signs of tension.  I used this model in my talk on crowdsourcing; the goal is for the big organizations to leverage their processing and analytic capacity to produce data that can be used by local actors to respond to tension and threats of violence themselves.

What made the discussion around this challenge so interesting was that the speakers and audience were able to focus not just on the technology, but also on the ways that different cultures understand information and space.  Matthew Pritchard of McGill University gave a fantastic talk about the challenges of mapping land tenure claims in Liberia, since people expressed land ownership in different ways.  He explained that GIS mapping could contain the data on how people understand their relationship to the land – maps layers could have MP3 recordings of oral history, photos of past use, and graphical demonstrations of where borders were.  Finding ways to move beyond external perceptions of local conflict drivers was one of the goals of the discussions, and integrating technology and social science more effectively is increasingly going to be a way to achieve that goal.

This event was also bittersweet for me, since it was my last time officially representing TechChange as their Director of Conflict Management and Peacebuilding.  Starting May 9, I will be joining Mobile Accord as GeoPoll’s Research Coordinator.  After over two years working with Nick Martin and the team at TechChange, I’ve decided it’s time to focus more on data and analytics in the ICT for development space.  While I’m excited for this new challenge, I’ll miss working in the loft where I’ve learned almost everything I know about ICT4D and tech for conflict management.  I wouldn’t be where I am academically or professionally without the insights and support of the colleagues and friends I’ve made at TechChange.  While I’m looking forward to joining the team and GeoPoll, I’ll always be excited to check the blog or cruise by the office to see what amazing new animation or interactive learning platform Will Chester and the TechChange team have conjured up!

This is a guest post by Dhairya Dalal. If you are interested in using crisis mapping and using technology for humanitarian relief, conflict prevention, and election monitoring, consider taking our course Technology for Conflict Management and Peacebuilding.

Overview

Recently, I had the opportunity to run an election monitoring simulation for TechChange’s TC109: Conflict Management and Peacebuilding course. Led by Charles Martin-Shields, TC109 taught over 40 international participants how mapping, social media, and mobile telephones could effectively support the work of conflict prevention and management.  Robert Baker taught participants how the Uchaguzi team leveraged crowd-sourcing and Ushahidi, a web based crisis mapping platform, to monitor the 2013 Kenyan elections.

For the simulation activity, my goal was to create a dynamic hands-on activity. I wanted to demonstrate how crisis mapping technologies are being used to promote free and fair elections, reduce electoral violence, and empower citizens. To provide students a realistic context, we leveraged live social media data from the Kenyan elections. Participants walked through the process of collecting data, verifying it, and critically analyzing it to provide a set of actionable information that could have been used by local Kenyan stakeholders to investigate reports of poll fraud, violence, and voter intimidation.

Below I’ll provide a brief history of election monitoring in the context of Kenyan elections and provide a more detailed look at the simulation activity.

Brief History of Election Monitoring and Uchaguzi
uchaguziIn 1969, the Republic of Kenya became a one-party state whose electoral system was based on districts that aligned with tribal areas. This fragile partitioning often generated internal friction during the electoral cycle. The post-election violence of 2007-2008 was characterized by crimes of murder, rape, forcible transfer of the population and other inhumane acts. During the 30 days of violence more than 1,220 people were killed, 3,500 injured and 350,000 displaced, as well as hundreds of rapes and the destruction of over 100,000 properties. 2

Ushahidi was developed in the wake of the 2008 post-election violence. Ushahidi, is a website that was designed to map reports of violence in Kenya after the post-election fallout. However, Usahidi has since evolved into a platform used for crisis mapping, crowd-sourced data gathering, and many other things. Since then, the name Ushahidi has come to represent the people behind the Ushahidi platform. 2

Uchaguzi was an Ushahidi deployment, formed to monitor the 2013 Kenyan general elections held this past March. The Uchaguzi project aimed to contribute to stability efforts in Kenya, by increasing transparency and accountability through active civic participation in the electoral cycles. The project leveraged existing (traditional) activities around electoral observation, such as those carried out by the Elections Observer Group (ELOG) in Kenya.3

Election Monitoring with CrowdMaps
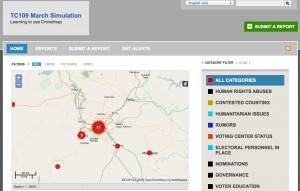
TC109 Simulation Figure 1: TC109 Simulation map (view official Uchaguzi map here: https://uchaguzi.co.ke/)

For the simulation activity, we used Ushahidi’s CrowdMap web application. CrowdMap is a cloud-based implementation of the Ushahidi platform that allows users to quickly generate a crisis map. Crowdmap has the ability to collect and aggregate data from various sources likes SMS text messages, Twitter, and online report submissions.

To provide the participants a more realistic context, our simulation collected real tweets from the Kenyan elections that had just occured the prior week. Our simulation aggregated tweets from Uchaguzi’s official hashtag, #Uchaguzi, as well several other hashtags like #KenyanElections and #KenyaDecides. In addition students were tasked with creating reports from Uchaguzi’s facebook page and local Kenyan news sites.

The aggregated information was then geo-tagged, classified and processed by the participants. The participants created reports, which described incidents licrowdmapke instances of voter intimidation, suspected poll fraud, and reports of violence. The CrowdMap platform plotted these reports on a map of Kenya based on coordinates the participants provided during the geo-tagging phase.  The resulting map showed aggregation patterns, which would have allowed local actors to see where certain types of incidents were taking place and respond accordingly.
Conclusion: Going beyond the Technology and Cultivating Information Ecosystems
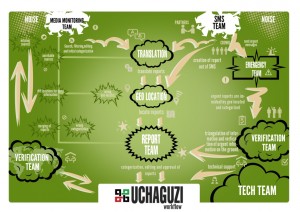
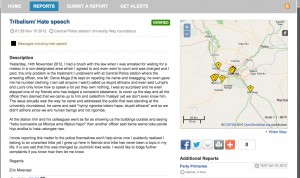
workflow   Figure 2: Uchaguzi Workflow

While technological innovations have made it easier to collect vast amounts of data in real-time during a crisis or an live event, a lot of process and human capital is still required to ensure that the data can processed and acted upon. Prior to the Kenyan elections, the Uchaguzi team established a well-planned information workflow and local relationships to ensure that information was ultimately delivered to the local police, elections monitors, and other stakeholders who could take action on the reports received. This workflow also delineated volunteer workgroups (based on Standby TaskForce’s information processing workflow) which were responsible for different parts of information collection process from Media Monitoring and Translation to Verification and Analysis.

To provide the participants an understanding of the full picture, we had them assume the role of various workgroups. They were challenged to identify how the information would be gathered, verified, classified, and distributed to local stakeholders. Participants followed the official Uchaguzi workflow and learned more about the challenges faced by the various workgroups. For example how would you translate a report submitted in Swahili? How would you determine if a report is true or falsely submitted to instigate provocation? How would you escalate reports of violence or imminent danger like a bomb threat?

Overall, the participants were able to learn about both the technology that enables the crowd-sourcing of election monitoring and the strategic and deliberate structures put in place to ensure an information feedback loop. Participants were able to gain an understanding of the complexity involved in monitoring an election using real data from the Kenyan elections. They were also given an opportunity to recommend creative suggestions and innovations that were sent to the Ushahidi team for future deployments.


About the Author:
Dhairya Dalal is a business systems analyst at Harvard University, where he is also pursuing his master’s degree in Software Engineering. Dhairya serves a curriculum consultant for TechChange and is responsible for teaching hands-on technical workshops centered around crisis mapping and open gov APIs, as well as strategic lessons on social media strategy and digital organizing.

Sources:
1:Background on the Kenyan Electoral Violence
http://www.haguejusticeportal.net/index.php?id=11604 
2: Uchaguzi Deployment
https://wiki.ushahidi.com/display/WIKI/Uchaguzi+-+Kenyan+Elections+2013
3: Uchaguzi Overview
http://reliefweb.int/report/kenya/uchaguzi-kenya-2013-launched

We’re excited to partner with the mHealth Alliance yet again to offer our Mobile Phones for Public Health for open enrollment. And we think it matters: When it comes to IC4D (or M4D) projects, even the best technology is often not as helpful as the latest best practices. Patty Mechael, the Executive Director of the mHealth Alliance, was recently quoted in an NYT article about lessons learned from the past ten years of “mobile phones for public health” concluded:

“The tech is only as good as the people it is connecting or system it’s connected to,” Mechael said. ”We can get excited about the shiny new object, but the real impact comes from thinking about the cultural and professional context in which it’s being implemented.”

That same article cast a skeptical eye on the impact of many mHealth programs to date, but singled out Project Mwana as being successful on a large scale in Zambia and Malawi for testing babies of H.I.V.-positive women. When asked to describe what makes Mwana work, Erica Kochi, the co-leader of tech innovation for UNICEF (and confirmed speaker in our upcoming course) described: “Incredible simplicity….It’s not trying to replace the health information system.  For its users, it makes things easier rather than adding more

Nick Martin interviewing Merrick Schaefer

mHealth Interview with Merrick Schaefer on Project Mwana

complexity to an already difficult, challenging health system.”

But mHealth solutions aren’t as simple as scaling successful programs irrespective of context. It requires creating an ongoing dialogue between public health professionals, the medical community, technologists, and government funders.

To that end, we’ve attempted to not just build a successful-project showcase, but a conversation that includes the following speakers and organizations:

  • Robert Fabricant, Frog Design
  • Gustav Praekelt, Praekelt Foundation
  • Alain Labrique, JHU University
  • Sarah Emerson, Center for Disease Control Tanzania
  • Erika Cochi, UNICEF Innovation
  • Yaw Anokwa, Nafundi
  • Martin Were, Regenstrief Institute; Hamish Fraser, Partners in Health
  • Armstrong Takang, Federal Ministry of Health
  • Kirsten Gagnaire, MAMA Global
  • Lesley-Anne Long, mPowering Frontline Workers; Sandhya Rao, USAID

Class starts June 3rd. Visit the mHealth course page to apply and reserve your spot today. Seats are filling up quickly. We hope that you’ll join the conversation!

When something breaks mid-class it can be awfully hard not to blame your students. But the truth is that nobody cares about the tech you’re used to using or how it works optimally. They care about what works right now.


I recently had the pleasure of facilitating a small, intensive course that revolved around back-and-forth between a handful of students in remote locations and a subject-matter expert. In the second day of the class, our video platform (that had only days earlier managed dozens of participants without difficulty) was already cracking at the seams while students conversed over low bandwidth from locations in Africa and E. Europe. One student suggested switching to Skype, which ended up working significantly better for the remainder of that session.

The reason was fairly simple: Instead of having to use the centralized OpenTok servers in remote locations, the Skype users could connect through nodes everywhere because they themselves were acting as nodes. Skype is essentially a modified peer-to-peer (P2P) network application, which is why Skype works as well as it does in remote areas — you are both the user and the provider for other users of video conferencing.

So, problem solved. Now we just move back to Skype and get rid of our existing OpenTok video platform. Right?

Not exactly.

Online education requires tradeoffs. The more interactive your class, the more strain you will place on your system at scale, which is exactly what Coursera stumbled upon recently during their “MOOC Mess“ as they tried to provide a facilitated format to 41,000 students. Online education gets lumped into one category, but ultimately 1-on-1 or small discussion sessions are entirely different experiences than facilitated workshops or massively open online courses (MOOCs). Since we try our hardest to be platform agnostic, we’re always looking for new ways to engage students via video while always looking for a better web-conferencing platform as needed. Generally, this is has created our current rule-of-thumb for class size and video conferencing:

  • Under 10 students: Skype Premium (especially in low-bandwidth)

  • 10-150 students: OpenTok (but works fine for low-bandwidth with video toggling)

  • Massive: YouTube or Vimeo (use forums or such instead for asynchronous engagement)

If you’re looking for an off-the-shelf solution for holding a small webinar or sharing your taped lecture, you’d be hard pressed to do better than Skype or Vimeo/YouTube. We hold occasional webinars on Skype and host our educational video content (and animated videos) on existing video platforms, which we then share in our media library. But our problem has consistently been that we believe good educational learning and a “flipped classroom” model to exist somewhere between the two models — more than a webinar, but not quite a MOOC. And that scale is achieved not by speaking at an audience of 50,000, but by engaging an interested 50 online in as close to a classroom-like format as possible. That’s why we’ve gone to such lengths to build a customized video streaming solution in OpenTok for our students. Still, it’s good practice to constantly evaluate and re-evaluate the options, so we wanted to share some of our thoughts below on the relative advantages of each platform:


Skype

OpenTok

Requires download

No download required

Clearer and more responsive real-time audio chats of 4-10

Flexible real-time chat of 1-50 (simultaneously publishing, up to thousands viewing only)

Login required (SkypeID)

No login required

No administrative controls

Enable / block speakers as needed

No optimizing for high / low bandwidth

Client-side toggling of video

Proprietary format

Open API for custom integration


That said, we’d love to hear from you. What has worked well for your organization? Please let us know in the comments below if you have suggestions.


On February 26, USAID received the “Best Government Policy for Mobile Development” award at GSMA’s Mobile World Congress 2013. And while the Mobile Solutions team was receiving an award in Barcelona, TechChange and the MS team were also receiving over 1,500 mobile poll responses from recipients in DRC taking part in an online exercise designed by 173 USAID staff and implementing partners in 21 countries. The way this was possible is through harnessing the same potential for public-private partnerships used for external implementation and applying it to internal education and collaboration at USAID.


Fig. 1: MapBox visualization of GeoPoll responses.

The exercise was part of a 4-week online course in Mobile Data Solutions designed to provide a highly interactive training session for USAID mission staff and its implementing partners to share best practices, engage with prominent technologists, and get their hands on the latest tool. Rather than simply simulating mobile data tools, USAID staff ran a live exercise in DRC where they came up with 10 questions, target regions, and desired audience. The intent was to not teach a tool-centric approach, but instead begin with a tech-enabled approach to project design and implementation, with an understanding of mobile data for analysis, visualization, and sharing.


Fig. 2: Student locations for TC311 class.

This would have been a formidable exercise for any organization, but fortunately we augmented USAID’s development capacity with the abilities of three organizations. TechChange provided the online learning space, facilitation, and interactive discussions. GeoPoll ran the survey itself using their custom mobile polling tool. And MapBox provided the analysis and visualization needed to turn massive data into a simple and attractive interface. (Want to check out the data for yourself? Check out the raw data Google Spreadsheet from GeoPoll!)

But while the creation of an interactive online workshop for small-group interaction requires barriers to scale, the content is under no such restrictions. One of the videos from our previous course on Accelerating Mobile Money provided an animated history of M-PESA, the successful mobile money transfer program in Kenya, which allows everything mobile phone users to pay for everything from school fees to utility bills and is proving transformative in cases such as Haiti.


Fig. 3: M-Pesa animation used for TC311 and USAID Video of the Week

But there’s still plenty of work to do. As mobile phones continue their spread to ubiquity, the challenges for applying their potential to development will only increase, along with the continuing possibilities as the technology continues to improve. However, in the short term, we’re focused on increasing mobile access, which is the topic of our next course. If you work at USAID or with an implementing partner, we hope that you’ll consider joining us and lending your voice to this process.