In our modern times of media cycles fighting for our short attention spans, it is easy to ride the momentum of a highly visible campaign that can quickly fizzle out once another competing story emerges. Since the kidnappings of approximately 300 Nigerian girls by militant Islamist group Boko Haram last month, the international community has embraced the hashtag, “#BringBackOurGirls”, in a very vocal and visible social media campaign demanding action to rescue the Chibok girls. But one month since the mass kidnapping without the rescue of the girls, do we need to take a different approach? Will #BringBackOurGirls be just another campaign we forget about once the next celebrity scandal becomes breaking news?
#BringBackOurGirls goes global starting in Nigeria
Most of the #BringBackOurGirls campaign activity has been highly visible on Twitter, Facebook, and international media outlets. In this fascinating Twitter heat map created using the tool, CartoDB, featured in TIME Magazine, we can see a time-lapsed digital map of how the hashtag, “#BringBackOurGirls” spread globally, starting organically from within Nigeria in mid April.
(We’ll be touching upon CartoDB, and other digital mapping tools in our upcoming Mapping for International Development course later this month.)
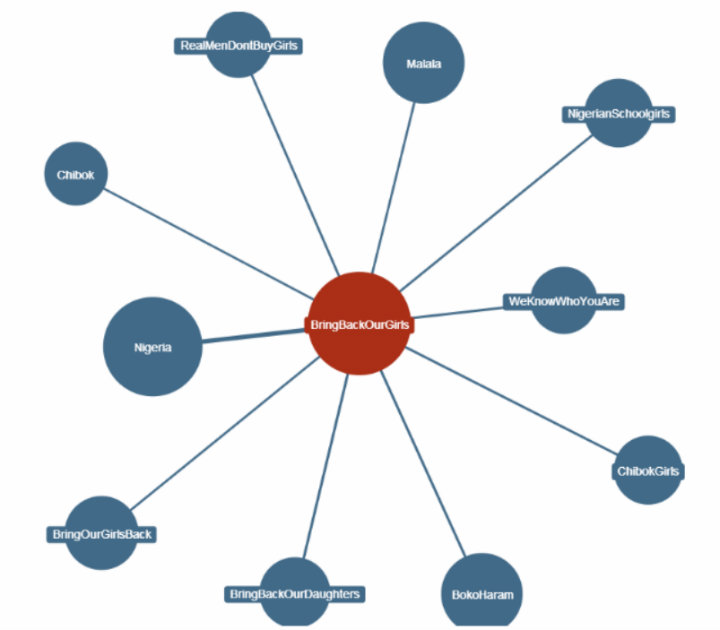
The #BringBackOurGirls hashtag has been embraced widely by many public figures and has garnered wide support across the world. Michelle Obama, David Cameron, and Malala Yusafzai have posted images with the hashtag, along with celebrities such as Ellen Degeneres, Angelina Jolie, and Dwayne Johnson. To date, nearly 1 million people signed the Change.org petition. Countries including the USA, UK, China, Israel have pledged to join the rescue efforts, and other human rights campaigns have joined the #BringBackOurGirls Twitter momentum, as seen on this Hashtagify map.
Is #BringBackOurGirls repeating the mistakes of #KONY2012?

A great example of a past campaign where this happened was with the KONY2012 campaign, which brought some albeit short-lived urgency to addressing the child soldiers recruited by Joseph Kony, leader of the Lord’s Resistance Army (LRA). Michael Poffenberger, who worked on that campaign, will join us a guest expert in TC110: Social Media for Social Change online course in June 2013 and compare it the current #BringBackOurGirls campaign. Many have drawn parallels to both campaigns and warned of the false optimism that hyped social media messages can bring when context is not fully considered and understood.
According to Lauren Wolfe of Foreign Policy magazine, “Understanding what has happened to the Nigerian girls and how to rescue them means beginning to face what has happened to hundreds of thousands, if not millions, of girls over years in global armed conflict.” To some critics, this hashtag trivializes the weaknesses of Nigerian democracy that have been exposed. Critics of using social media in advocacy campaigns have used the term “slacktivism” to describe the passive, minimal effort needed to participate in these movements. Others have cited such media waves being exploited for individual gain, as opposed to genuinely benefiting the girls. Florida State University Political Science professor, Will H. Moore, argues that this hashtag activism is not only hurting the larger cause of rescuing the kidnapped girls, but actually helping Boko Haram. Jumoke Balogun, Co-Founder of CompareAfrique, also highlights the limits of the #BringBackOurGirls hashtag impact.
Hashtag activism, alone, is not enough
With all this social media activity and international press, what actual progress has been made in rescuing the kidnapped girls? If the objective is raising awareness of the issue, yes, the hashtag has been successful. If the objective is to rescue the girls, we still have a long way to go, even if the hashtag campaign has been part of a multi-pronged approach to galvanize resources into action.
The bottom line: social media can be a powerful tool to bring visibility and awareness to a cause, but a hashtag alone is not enough to bring about social change. There are a myriad of resources that must be coordinated to effectively implement this rescue mission, which will only become more difficult as more time passes. However, prioritizing and shining a sustained light on the problem, instead getting distracted by competing media cycles on celebrities getting into petty fights, is the first step toward a solution.
===
What do you think about the impact of the #BringBackOurGirls campaign? We’re only scratching the surface here on the topic of social media for social change and invite you continue the discussion with us in our upcoming Social Media for Social Change online course which runs June 16 – July 11, 2014.