The Global Database of Events, Language and Tone (GDELT) has been gathering and databasing all the news events related to conflict and political protest dating back to 1979. GDELT continues to be fed new data through the various global news services, automatically updating every day. At the end of July GDELT released their Global Dashboard which visualizes all of their data collected from February 2014 to present on a map of the world. It’s a fantastic tool for conflict management and resolution professionals who are interested in big data, since it takes their information and puts it in a visually attractive, easily navigable format. This is an exciting development, so how does it work and what can peacebuilding practitioners get out of using GDELT’s event data?

The first thing to keep in mind is that the Dashboard is new. As it stands there are only two filters for event data (‘conflict’ or ‘protest’), but there are plans to expand these filters so that users can easily focus on the events that are of most interest. For now they’ve done a pretty good job of helping filter out conflict events, which are basically events involving kinetic violence, from protest events, which could end up being violent but are generally more along the lines of protests and social action. While basic, these are good starting points for an initial filter. The nice thing about the dashboard though is that if I have some expertise about the region or event I’m interested in gathering data on, I don’t need the filters because I can use geography and date to narrow my search. The Dashboard allows the user to take advantage of their contextual knowledge to filter the data, so while the built-in filters that come later will be helpful researchers can still use the database efficiently now.

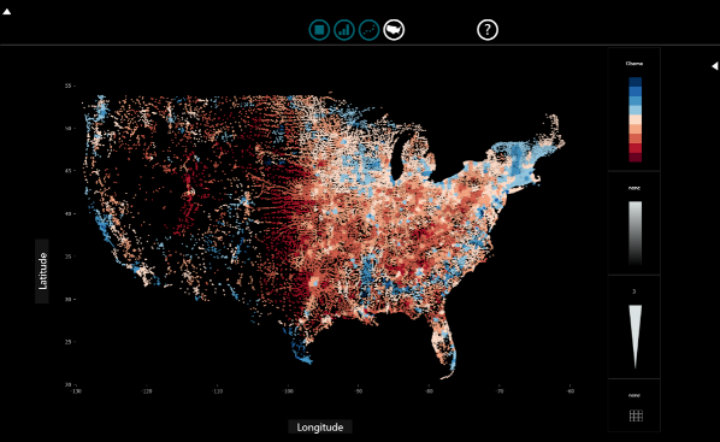
Let’s say we’re interested in recent protest events in South Africa, but we want to know if there have been any in smaller cities, since we know that there’s likely to be a lot of political action in places like Cape Town and Johannesburg. I started with the Dashboard zoomed out to the maximum, so I could see the whole world, then went to the bottom left and set the date that I was interested in seeing news from. For this test I picked August 3, 2014. Below is what the screen looked like at this point:

GDELT Global Dashboard

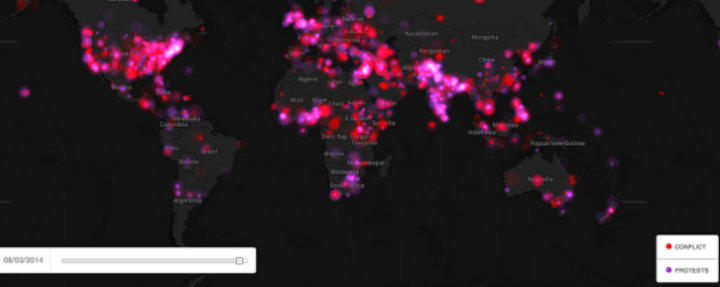
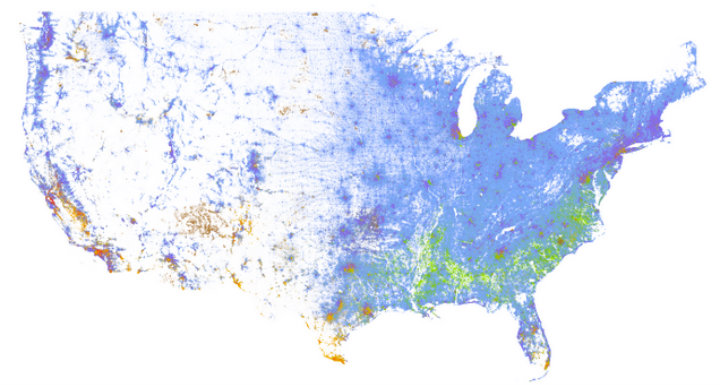
We can see the whole world, and in South Africa there are big dots indicating aggregated data. Since I want to see what’s happened outside the main cities, I zoomed in until the dots started to disaggregate, then I selected the ‘protest’ filter to remove the ‘conflict’ events. Once I was zoomed in the filter was set, I found that there was a protest event in Port Elizabeth so I clicked on the dot and a box with the web addresses for news articles about a protest against money being spent on a museum appeared: GDELT Global Dashboard: South Africa

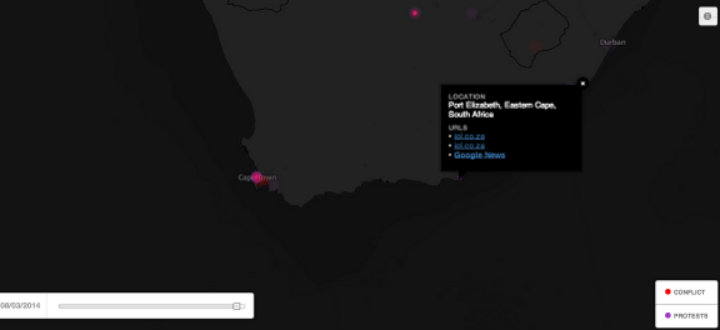
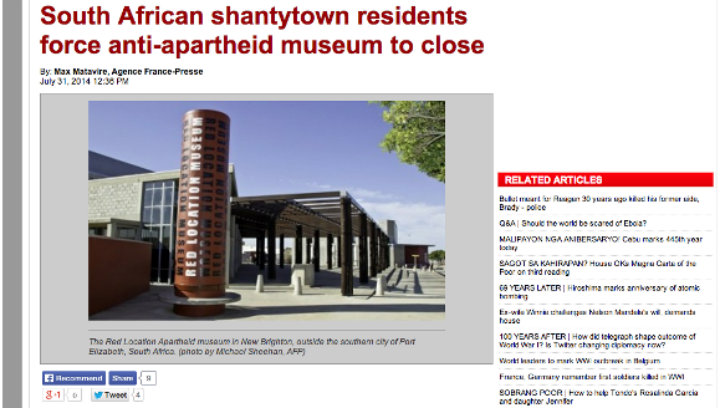
I clicked on the Google News link, which took me to the related articles that Google had collected about that protest and read one that had been reposted by a local news service from the Agence France-Presse:

"South African shantytowns residents force anti-apartheid museum to close," Agence France-Presse

I managed to do this in a few minutes using the Dashboard, work that would have taken longer if I was just doing searches for protest news out of South Africa. What makes the tool really useful is that I can search in a few different dimensions. If want to know if this is the first time there has been social action around the museum in Port Elizabeth, I can leave the map zoomed in to that location and scan through the dates going back to February. What we can do, relatively easily, is see events and narratives spatially and analyze how they change over time.

This is a big dataset, so I thought hard about what its value added is from a methodology perspective. As I dug through the data, I realized something important. I’m not sure this is a database that will be particularly useful for forecasting or predictive analysis. You might be able to identify some trends (and that’s certainly a valid task!), but since the data itself is news reports there’s going to be a lot of variation across tone and word choice, lag between event and publication, and a whole host of other things that will make predictive analysis difficult.

As a qualitative dataset though, the GDELT data has incredible value. A colleague of mine pointed out that the Dashboard can help us understand how the media conceptualizes and broadcasts violence at the local level. Understanding how news media, especially local media, report things like risk or political issues is valuable for conflict analysts and peacebuilding professionals. I would argue that this is actually more valuable than forecasting or predictive modeling; if we understand at a deeper level why people would turn to violence, and how the local media narrative distills or diffuses their perception of risk or grievance, then interventions such as negotiation, mediation and political settlements can be better tailored to the local context.

Big Data is a space that is both alluring and enigmatic for conflict resolution professionals. One of the key challenges has always been making the data available in a way that is intuitive for non-technical experts to use. GDELT’s Dashboard is a great start to this, and the possibilities for improving our understanding of conflict through the narratives we can observe in the media are going to grow rapidly in the next few years.

This post originally appeared in Insight for Conflict on September 19, 2014. 


Delanie recently joined us as an Online Instructional Designer where she will build eLearning courses for TechChange’s clients. Before moving to DC to join TechChange, Delanie lived in Uganda where she worked at the Infectious Diseases Institute as a Global Health Corps Fellow. She holds a B.A. in Peace and Conflict Studies, with a minor in Global Poverty and Practice, from the University of California, Berkeley.

In her free time Delanie enjoys playing the oboe in orchestras.

Welcome Delanie!


TechChange COO Chris Neu is fond of pointing out that in social change, technology is only 10% of the equation while the rest is about the humans using that technology. That 10% is a pretty powerful percentage though, and when technology is used effectively, it can amplify voices of peace and empower local communities that want to find alternatives to violence. It’s easy to forget though that technology isn’t the most important part of any information and communication technology (ICT) for peacebuilding enterprise; it’s the people, both the beneficiaries and the peacebuilders (who can be one and the same!). Because what we’re doing with ICTs in any peacebuilding context involves asking people to share data and participate in interventions, we must be aware of the risks participants face and how to manage those risks. The problem is that we face a variety of risks at multiple different levels when using ICTs in any political environment, so what are a few things we can focus on while planning a project?

An Institutional Review Process as a Starting Point
There are a variety of simple starting points. For example, if you are an academic or affiliated with an academic institution, they require you to go through an institutional review process before you can do any research involving human subjects. This would include doing a crowdsourcing project using SMS text messaging or social media. Many institutions have some kind of process like this, so check before you deploy your project. While tedious, the process of defending your risk management procedures can help you identify a lot of problems before you even start. If you don’t have an internal review board, grab a copy of the ICRC’s “Professional Standards for Protection Work” and check your project design and risk management against the recommendations in Chapter 6.

Along with doing this kind of standard review, what are some other factors that are unique to ICTs that you should be aware of?

1) National Infrastructure and Regulatory Policy
The first is that ICTs are part of national infrastructure, and are regulated at the national level. When you use any kind of transmission technology in a country, the rules for how that data is transmitted, stored and shared are set at the national level as part of regulatory policy. If the government in the country you’re working in is repressive, chances are they have very broad powers to access electronic information since they wrote the regulations stipulating data privacy. In general locals will be aware of the level of surveillance in their lives, so do your legal homework about the regulations that people have actively or passively adapted to. These are usually titled something like “Telecommunications Act” or “Electronic Transmission Act”, and are often available for public viewing via the web.

2) Legal Compliance
If you’re going to go forward with an ICT-supported peacebuilding program after doing your legal homework, ethical practice starts at home. Unless you are reasonably adept at reading and interpreting legislation, did you have someone with a legislative or legal background interpret the privacy laws in the country you’re about to work in? Does your team have someone with expertise on the technical and policy aspects of using ICTs in a conflict-affected or high risk environment? Has the entire project team had some basic training in how ICTs work? For example, does everyone understand the basics of how a mobile phone works, how to protect sensitive data, and the implications of having people share data on electronic platforms? Before showing up in a conflict-zone and asking people to participate in your project, you should make sure your team understands the risks they are asking people to take.

3) Informed consent
What do the local project participants know about ICTs? In terms of safety, people are generally aware of what will get them in trouble. Always assume that your perception of risk in a country is under-informed, even if you’ve read the laws and done some regulatory analysis. With this in mind, if you’re going to ask people to take risks sharing electronic information (always assume that sharing electronic information is risky), do you have a process for assessing your participants’ knowledge of ICTs and then addressing any gaps through training? Do you and your team understand the technology and regulations well enough to make the risks to partners clear, and if they still choose to participate provide risk management training? Informed consent means making sure you and your partners are both equally clear on the risks involved in what ever project you’re doing.

Peacebuilding carries some level of inherent risk – after all, we’re dealing with conflict and violence. ICTs carry a unique set of risks, compounded by both the nature of digital information and the capacity for governments and conflict entrepreneurs to exploit this information. An effective ICT for peacebuilding program addresses these risks from both the legal and technical sides, so that implementers and local partners are equally informed and able to use the tools in the safest, most effective way.

Want to learn more about the ethical issues facing peacebuilders using technology? Enroll now in our Technology for Conflict Management and Peacebuilding online course which runs October 6 – 31, 2014


Image source: Tech Republic

Katherine (Katie) Perry has recently joined us as a communications and operations associate where she will be key in TechChange’s daily operations and communications efforts. Katie previously served as a researcher at the Youth, Prosperity, and Security Initiative at the Center for Strategic and International Studies (CSIS), where she examined the intersection of youth, international development, and security. She was also a contributing author to the CSIS-IYF Global Youth Wellbeing Index. Prior to her work at CSIS, she lived and worked in Hokkaido, Japan, teaching English through the Japan Exchange and Teaching (JET) Program. Katie holds a B.A. in international relations and Japanese from San Francisco State University, and M.A. from the George Washington University in international affairs, concentrating on international security and development.

Fun fact: Katie enjoys not knowing the lyrics to any of Katy Perry’s songs.

Welcome Katie!

In his 2006 TED talk, Hans Rosling used data visualizations to deconstruct his students’ assumptions about the ‘developed’ and ‘developing’ dichotomy of countries. He looked at the patterns and demonstrated how they were easily recognizable and showed something contrary to the original belief. Pattern recognition is the core power of data visualization and more companies are embracing the notion of  “putting humans back in the decision making process”.

Good data visualizations make patterns and outliers easy to recognize and aesthetically pleasing. The data are “liberated” from numbers and letters into a form that can be easily analyzed and understood by everyone.

Here are some great examples of liberating data through data visualizations

1. Microsoft’s SandDance Project

Microsoft recognized the importance of humanizing data with the SandDance project in terms of designing the data exploration experience using “natural user interaction techniques.”

SandDance

2. Cooper Center’s Racial Dot Map of the US

US Census data is made freely available online for anyone to transform into a complex and understandable visualization. The data is available geocoded and as raw survey results. Last summer Dustin Cable took the 2010 census data and mapped it using a colored dot for every person based on their race: blue is White; green, African-American; red, Asian; orange, Hispanics; and brown, all other racial categories. The resulting map provides complex analysis quickly.

USA Racial Dot Map

At a glance, it is easy to see some general settlement patterns in the US. The East Coast has a much greater population density than the rest of America. It slowly gets less dense until the middle of America where there is extremely low density until the West Coast. Cities act as a grouping point: density typically decreases in relation to the distance from a city. The population of minorities is not evenly distributed throughout the US with clearly defined regional racial groupings.

San Luis Obispo, CA

As you scan through California, an interesting exception stands out just north of San Luis Obispo. There is a dense population of minorities, primarily African-Americans and Hispanics. A quick look at a map reveals that it is a men’s prison. With more data you can see if there are recognizable patterns at the intersection of penal policy and racial politics.

3. Google Public Data Explorer

Google has created dynamic visualizations for a large number of public datasets. There are four different graph types, each with the ability to examine the dataset over a set period of time. With the additional element of time, new patterns can emerge.

Examining the World Bank’s World Development Indicators data set to compare fertility rate and life expectancy a pattern emerges: as life expectancy increases, fertility rate decreases. However, some notable exceptions occur. In 1975, Cambodia has a life expectancy slightly over 20 years, less than half of most countries with a similar life expectancy. It is also the year the Khmer Rouge took power leading to mass killings in Cambodia.

This exception to the normal pattern shows how strong of an impact a single event made. Data visualization makes recognizing this pattern and outliers as easy as watching a short time-lapsed video.

I’ve always believed that data are more than just collected information. Data have a purpose and are meant to be analyzed. New technologies have made visualizing data easier than ever and the data are more accessible to everyone.

What are some of the best data visualizations that you have seen, or maybe even created yourself? Please feel free to share in the comments or tweet @normanshamas or @TechChange.

Want to learn more about data visualization and analysis? Enroll now in TechChange’s new online course on Technology for Data Visualization and Analysis  that runs June 1 – June 26, 2015.

In the last decade, new technology has made advances in data storage and analysis to leverage the greater volume of data available. The digital universe made up of all the data we create and copy will only increase in the future. The International Data Corporation and EMC’s research says that the digital universe is doubling in size every two years and by 2020, will contain nearly as many digital bits as there are stars in the universe (reaching 44 trillion gigabytes).  We now live in a period of time defined by data: Data scientists are the new must hire position yet, McKinsey & Co.’s research says that by 2018, the U.S. will experience a shortage of 190,000 skilled data scientists.
McKinsey research on data scientists in different industriesWhat industries are the data scientists working in now

Government surveillance through internet data has been in the news since Edward Snowden’s leaks, and the popularity of sites such as FiveThirtyEight has popularized data journalism. International development donors have recognized this and are demanding more data from implementing partners and placing greater emphasis on monitoring and evaluation (M&E). While M&E is used to cover a wide variety of activities–from reporting to research–at its core, it is a way to ensure international aid programs are providing effective interventions.

Much like how the data revolution has sparked innovative software for the private sector through NoSQL data storage, software and technological innovation for M&E is beginning in international development. A reflection of conversations during Tech Salon’s M&E discussion show that M&E tend to be afterthoughts to program design because of fear of failure and the lack of funds. However, today technology and M&E are increasingly being requested in international development.

Here are a few reasons why we need to better integrate technology, M&E, and international development.

Greater Transparency

The US government has embraced the data revolution by providing open access to some of its data. This access provides not only greater transparency, but also greater scrutiny over spending and its efficacy. Anyone can easily see how much money the US government is spending on foreign assistance and engage in dialogue on whether the money is being spent properly and effectively. Initiatives such as the International Aid Transparency Initiative (IATI) work towards greater transparency across all donors and have established one standard for donors to report information on monetary flows in development.

Using technology-enabled M&E effectively will allow development implementers to prove program efficacy more quickly and easily. Programs can adapt activities on the basis of real time M&E, providing more benefit to beneficiaries. Global indicators can be used to show impact throughout multiple projects. Visualizations, such as maps, can present the wealth of data collected into an easily understood form.

World Bank Data Visualizer: Formal Financial InstitutionWorld Bank Data Visualizer world map

Proving impact and greater accountability helps USAID and other clients justify spending money on development programs to their stakeholders. In turn, the clients can keep funding programs and continue helping people throughout the world.

Data responsibility

Snowden’s revelations have brought the conversation of data responsibility and privacy to the general audience. For development practitioners, as donors request more and more data, we need to think about how to collect the data while protecting the beneficiary. It is important to consider what technology is appropriate for M&E as well as the metadata that it might reveal.

Utilizing technology-enabled M&E is more than including mobile phones into the process. It requires considering what data needs to be collected and whether it can do any harm to a beneficiary if the wrong person gains access to it. Technology and their limitations need to be understood to design data collection and any limitations for data analysis.

Put simply, technology is a tool for the M&E practitioner, not a solution on its own. The concerns about data responsibility are not new to development, but understanding the technology is.

Technology makes practitioners’ lives easier

Most importantly, technology-enabled M&E eases the work of practitioners. Imagine working in the field to collect information and instead of using pen/pencil and paper, you are using a tablet with a data collection app. This app allows you to work without internet connectivity and sync data when connectivity is available. You don’t have to worry about entering any geographic information, because it is either associated with a service location (e.g. school, community center) or the tablet saves your location for each entry.

M&E software companies, such as DevResults and SurveyCTO, create these tools so practitioners can focus on helping beneficiaries instead of recording and transcribing data. Field practitioners no longer need to record the same information in multiple locations and continually check to ensure no transcription errors occurred. Headquarters staff can use different types of data visualizations to more effectively develop theories of change and write reports much quicker.

By providing greater transparency, data responsibility, and making the the practitioners’ lives easier, technology is allowing practitioners to focus less on administrative tasks and more on effective program design.

To learn more about integrating technology and M&E in international development, sign up for our upcoming Technology for Monitoring and Evaluation online course.


Norman Shamas

Norman Shamas is the course facilitator for TechChange’s Technology for Monitoring and Evaluation online course. He also currently works as a data architect and wrangler to analyze foreign aid data at Creative Associates International. Previously he worked as a graduate student instructor at the University of Minnesota, where he studied identity from theoretical, social science, and policy perspectives. He has extensive experience in Israel and the West Bank where he has worked as an archaeologist and led dialogue groups. Norman speaks Hebrew and Persian and reads numerous dead languages. Norman enjoys telling stories, whether in words, images, or numbers. He has more than five years of experience teaching online and in person and facilitation in the US and abroad.


How do you measure peace?

In July, DME for Peace got in touch with TechChange to help tell the story about the challenges that peacebuilders face. DME for Peace (Design, Monitoring & Evaluation for Peace) is a project of Search for Common Ground that serves as a network of peacebuilding practitioners, evaluators, and academics. As a platform for conflict management specialists to communicate with each other, DME for Peace allows this professional community to share best practices and insights on how to design, monitor, and evaluate peacebuilding practices around the world.

TechChange’s Creative team tackled DME for Peace’s challenge of communicating their story in a short, yet compelling way. Like many narratives, the best way to tell DME for Peace’s story was through a short, engaging animation. As 65% of all people are visual learners, TechChange’s Creative Director, Alon Askarov believes that to make data intensive information easier for people to digest, we need to communicate these ideas through graphic and data visualizations. TechChange’s creative team spent 4 weeks to create various assets and animations to create a video to tell DME for Peace’s story about the great work they are doing. We enjoyed our first collaboration with Search for Common Ground on this project and hope to help tell more stories about other projects and organizations doing great work around the world.

If your organization is interested in working with us to create an educational animation video, please contact the TechChange Creative Team at info@techchange.org.

TC105: Mobiles for International Development alumna, Ivy McCottry is starting a job at AT&T after completing her TechChange M4D course and MBA at Wake Forest University.

Read on to learn how she broke into the mobile technology industry.

What interested you in taking TechChange courses?

I found TechChange when searching for ways to build up my technical background for using technology to improve lives. Through undergraduate Urban and Regional Studies courses, I knew I needed to demonstrate my interest in furthering technology and also be well-versed on current and emerging technical issues. I considered pursuing a tech-based MBA program and completed an MBA internship at a telemedicine startup. Later, I took a course on telemedicine with a clinical focus. While pursuing my MBA, I specifically sought out course work to supplement my business education with technology training.

Ultimately, I chose TechChange’s popular Mobiles for International Development course that offered a unique approach to learning with an international focus on the ubiquity of mobile phones. I saw this course as a great way to become familiar with various mobile initiatives at large, emerging mobile trends and major players in this space including GSMA and others.

What did you find useful from your TechChange course, Mobiles for International Development?

1. Demonstrating interest in technology with a credible certificate

Without an engineering background, the certificate I earned from completing the M4D course, together with my telemedicine internship, validated  my interest in technology. The certificate gave credence to my desire to work in the mobile technology industry.

2. Access to high quality guest experts

I knew that the guest experts for the course would be great, but the quality of these experts exceeded my expectations. For example, one of my favorite moments from the Mobiles for International Development online course was during a session with a Motorola phone designer who discussed literacy. I learned from him the importance of understanding customers’ literacy before you design products, and how design can promote literacy with intuitive user experiences. This layer of analysis for thinking about literacy in product development was new and fascinating to me.

 3. Diversity of resources and perspectives on global mobile use cases

In a class I took in my MBA program on Emerging Markets (BRICs), we discussed a Harvard case study on M-Pesa, which was covered in the TechChange M4D course in our discussions on mobile money. During this lecture, I was able to offer some different insights on M-Pesa that I had learned from the M4D course discussions on building products for the base of the pyramid. In my lecture, I cited materials on M-Pesa mentioned in the TechChange course and added to the MBA course materials.

What impact has TC105 had on you and your career?

1. Job offers from Fortune 100 companies

After finishing the Mobiles for International Development course, I received job offers from McKesson, which is involved with healthcare, and AT&T. I chose AT&T because of the opportunity to work on mhealth and more broadly, connected communities. It’s my goal to leverage my city planning and federal government experience to create smart/connected communities that improve life and safety matters. I recently joined AT&T to participate in a company leadership development program. In this program, I will be engaged in a variety of roles where I will learn about various aspects of AT&T’s business such as network operations, global products, and so forth.

2. Understanding the mobile industry landscape

Through the M4D course, I was able to better grasp what the drivers are for investment in mobile initiatives. I became very interested in learning about profitability and sustainability issues for mobiles from the perspectives of stakeholders like operators and the needs of mobile users. Additionally, I learned about the various business models being tested in this space and the various public private partnerships in place. This helps me have perspective about operators’ and users’ adoption factors.

3. Instant access to a well-connected global network

When I began my MBA program, I had no touch points with the mobile technology industry. Now, I have instant networks to various players within the field through the well-connected TechChange community.

What advice would you give to students taking TC105 or any TC course?

1. Know what you want to get out of the course.

The more you know precisely what you want to gain from the course, the more you will get out of it as you can prioritize those topics and ask questions that will focus discussions on areas you care about most.

2. Attend live sessions

The “live event” sessions are very helpful. Even though these sessions are recorded and archived, it’s good to sit in live because you can contribute questions in real time and process the context of what’s being presented. You also don’t have to mull over content independently – you can send questions immediately or expand on an idea that has been mentioned. When attending these events, I always made sure the facilitator knew I was there at the session so my private sector interests would be covered in the presentation.

3. Network with guest speakers and course participants

If speakers represent organizations that you want access to, definitely enroll in the course. The access that TechChange provides at this dollar value is unheard of and a great return on investment.

It also helped me to read profiles of other people who were taking the class and alumni as well. I was definitely inspired by the success stories of Carolyn Florey and Trevor Knoblich who advanced in their careers with the help of TechChange courses.

Interested in pursuing a career in mobile technology like Ivy? Enroll now in our Mobiles for International Development online course. Next round starts Monday, May 11.

Four months ago, we wrapped up our ninth TC105: Mobiles for International Development course here at TechChange. Fifty-eight participants joined us online from twenty-two different countries for our four-week course with guest experts, live events, and great discussions.

Our participants represented a variety of development and tech organization, including: DAI, Belgian Development Agency, UNICEF Nepal, Google, Vodafone, OECD, World Vision, Plan International, Mercy Corps  Yemen, NYU, Michigan State University, University of Denver, Helvetas, and more!

Some highlights from the course:

  • Collaborative Learning: After a session on M-Pesa, participants shared their excitement about the possibilities for M-Pesa, especially given the large migrant worker population abroad who send remittances back home and the influx of mobile phones in Cambodia and similarly in Albania. A participant from Tanzania wrote about the wide use of M-Pesa in Tanzania and also informed other participants about the outage of M-Pesa in Kenya during the post-election violence and other complications that come with mobile money regulations.

During the mobile data session with Democracy International, participants were asked to upload surveys on a mobile data platform and share their experience. They shared the ease and difficulties they experienced using mobile surveys in different platforms like Formhub, Textit, Magpi, and ODK providing insights for each other.

  • Guest Experts: The course was facilitated by Chris Neu with a line up of eleven guest experts. Guest experts included Amy Sweeney from GeoPoll, Arjen Swank of Text to Change, Kristen Roggeman of DAI (previously with GSMA mWomen), Gabriel White of Small Surfaces, and more! With access to a great panel of speakers, the participants enjoyed asking questions and interacting with them during our live events. One of the participants even interviewed a guest speaker for her final project.

Some of our participants summed up their experience with the course:

“The lineup of speakers is phenomenal, the tools are amazing, and the staff bring it all together on top of an online course platform that actually works. If you have interest in the ICT4D space, there is no better way to jump in than with a Tech Change course.” – Ian Reynolds, Ian Reynolds IT Services

“Week 2 had 4 great tools listed with videos/tutorials and a basic introduction to each which were very helpful for me. Being able to test them out was key for my understanding of how they worked. The background readings in week 1 were useful in understanding the context for this course. And the final project is a great way to synthesize everything from across the 4 weeks and put together something that showcases your learning.” – Kate DiMercurio, Monterrey Institute of International Studies

“Great survey course for the uninitiated. But if you’re interested in strengthening a specific area of expertise, the accessibility of experts and information is outstanding.” – Christina Eyre

“While I knew generally how mobiles could be used in development, this course really helped me realize the breadth and depth of how they can be used. Furthermore, it made realize how many considerations must be taken into account when designing a project that uses mobiles in order to create a product that is really useful for the target beneficiaries. I will be taking a lot of what I learned in this course and sharing it with colleagues for guiding future program development.” – Jacole Douglas, World Education Inc.

For our upcoming TC105 Mobiles for International Development online course, we are happy to welcome back Chrissy Martin and Amy Sweeney as guest experts in this course one more time and excited to hear from experts like Louise Guido, Steve Ollis, Jonathan Dolan, Jacob Korenblum, Louis Dorval, and Kelly Church.

Nearly two dozen people from ten different countries have already registered, representing organizations such as Task Force for Global Health, Management Sciences for Health, World Council of Credit Unions, Banyan Global, UNICEF, United Methodist Communications, Center for International Private Enterprise, Belgian Development Agency and many more!

Secure your spot in our upcoming TC105: Mobiles for International Development online course that starts on Sept 8th. Register now to save your seat!

Filming of Malaria Consortium staff doctor counselling a client on proper treatment of malaria. Uganda. (Photo credit: Maddy Marasciulo-Rice, Malaria Consortium)

Malaria in Context

There is an undeniable malaria problem in the world today. According to the World Health Organization (WHO) in March 2014, half of the world’s population is at-risk, hundreds of millions of cases are reported each year, and hundreds of thousands die annually of this disease. Around 90% of these cases occur in Africa, with children under 5 years old making up the largest demographic affected.

The burden of this disease on the health care systems of developing countries is immense: Uganda has the highest malaria incidence rate in the world with 478 cases per 1,000 population per year. Fully half of inpatient pediatric deaths in Uganda are caused by this disease and in Nigeria, the most populous African country, 97% of the population is at risk.

(Source: WHO 2013 Global Malaria Report)

How are the countries of Uganda and Nigeria addressing malaria?

While both Uganda and Nigeria have national malaria control and elimination programs, due to long waiting periods and frequent stock outs of the appropriate medications at local health facilities,  individuals prefer to go to private clinics, pharmacies and local drug shops to solve their health needs. When these pharmacists―often untrained in accurately diagnosing febrile illnesses―see a client complaining of fever, they often presumptively prescribe antimalarial medicines. The reverse scenario is also a common problem: pharmacists do not always give out artemisinin-based combination therapy (ACTs) when it is actually needed.

Pharmacists in Uganda

Pharmacists in Uganda assist customers with recommending antimalarial medications (Photo credit: Maddy Marasciulo-Rice, Malaria Consortium)

Presumptive treatment ― the overuse of antimalarials greatly increases the chances that malaria parasite resistance will develop and spread. In the future we might have one less weapon in our arsenal against these parasites. This overuse also means that the medicine is put over

How can rapid diagnostic tests (RDTs) help treat malaria?

Fortunately, rapid diagnostic tests, or RDTs, allow malaria to be diagnosed quickly, accurately, and cheaply, using only a drop of blood and a few drops of a solution. The problem is―there is no official quality control within the private healthcare sector―the pharmacists who provide the RDT to the patient have no way to choose a good RDT from the many options on the market and the wrong choice could lead to inaccurate diagnosis. Furthermore, many of the RDT sales representatives haven’t been trained to properly explain their product to their clients.

Challenges of RDT Training for Malaria in Uganda and Nigeria

RDTs to test for malaria and drugs to treat the disease are currently available in the private healthcare sector. However, there are several challenges to scaling up RDTs in this sector in Uganda and Nigeria.

1. Lack of training with Rapid Diagnostic Testing Materials

The primary barrier to appropriate care is the lack of training among pharmacists and RDT sales providers about how to use the test and interpret the results correctly to effectively diagnose and treat a range of febrile illnesses.

Malaria Consortium, based in the UK, is one of the world’s leading non-profit organizations specializing in the prevention, control, and treatment of malaria and other tropical diseases. Their projects can be found across twelve countries in Africa and Southeast Asia. The organization strives to find effective and sustainable ways to control and manage malaria through research, implementation, and policy development. They came up with the design for a plan that could greatly help manage the disease in both Nigeria and Uganda:

If the RDT sales representatives and RDT providers can be trained to correctly use the RDTs and recognize the symptoms associated not only with malaria but with other common illnesses, then the burden of misdiagnosis and mistreatment can be greatly reduced. Furthermore, as the sales representatives travel and frequently interact with providers, they can act as trainers and further disseminate the knowledge and skills necessary to accurately diagnose and treat these diseases.

2. Prohibitively high costs

The costs associated with arranging such a training are enormous―between transporting the students and teachers to a centralized location, renting a venue, arranging lodging, and coordinating a schedule, the budget for a large-scale training would quickly be out of control. Additionally, pharmacy owners and other stakeholders working in the private sector would most likely have to assume a loss of revenue during their time away from their business while at a training.

3. Technical limitations

An eLearning platform is much more ideal for these circumstances―it’s flexible, participants don’t need to travel far, you need fewer instructors, and the information can be processed at the student’s pace and repeated when necessary. The information is also standardized and consistent, which means that a large number of people can benefit from a high quality training experience.

 But how do you deliver an eLearning course when your audience has intermittent power and whose computers are not only often out-of-date, but lack the RAM, bandwidth, and software standards that such hi-tech learning platforms have come to expect?

eLearning Solutions for Reaching 3000+ Healthcare Providers for Malaria

Malaria Consortium partnered with TechChange to build a comprehensive digital course to train private sector health workers and RDT sales representatives in this context. This 11 module course includes around 400 slides for 6 hours of content takes participants through the biology behind the malaria parasite, discusses the medical philosophy behind diagnostic practices, and walks users through interactive scenarios for patients presenting a range of symptoms.

Testing TechChange Malaria Consortium modules in Uganda

Sales representatives and drug store owners in Uganda testing eLearning modules designed by TechChange and Malaria Consortium on rapid diagnostic testing for malaria. (Photo credit: Catherine Shen, TechChange)

1. Offline access and Ease of Use

Despite significant benefits such as flexibility and scalability, e-learning courses also face challenges in the developing world. Lack of sufficient internet bandwidth, reliable computers, and computer skills can pose major barriers to a training’s effectiveness.

To troubleshoot the technical issues, this course is designed to require nothing more than a computer and headphones – it comes preloaded onto USB drives so not even an Internet connection is necessary, allowing health workers in even the most rural areas to access this training. A computer tutorial is also included for health workers with little to no prior experience with computers. Our tech team is also devoted to helping solve any other technical issues that arise due to out-of-date software and hardware malfunctions, working as a remote IT team as Malaria Consortium rolls out the project.

 2. Localized content

In addition to including the relevant national laws, case studies, and local examples, the narration features Nigerian and Ugandan voice actors, art, and scenarios to make the training as culturally-relevant as possible.

 3. Hybrid learning

Only one part of the training won’t be computer-based; participants will still practice actually conducting the RDT tests in a face-to-face session before they begin pricking patient’s fingers for diagnosis.

The course is designed to reach upwards of 3,000 healthcare providers in the two countries and build their capacity to effectively serve their community’s needs. We look forward to seeing the impact of this training in improving quality of care in Uganda and Nigeria hopefully in the near future.

To learn more about TechChange’s custom training solutions, please contact us at info@techchange.org.

Emily Fruchterman, Catherine Shen, & Charlie Weems contributed to this post.