On this year’s International Women’s Day, we recognize the important work our alumni and partners are doing to empower women and girls across the world.

At TechChange, there are few areas we see this empowerment happening than in the field of family planning and reproductive health. As we’ve seen in our mHealth online course and community, many organizations are doing fantastic work in this area including the UN Foundation and MAMA, D-Tree International, FHI 360, Jhpiego, John Snow Inc., and more.

We’re hoping to further explore the issue of gender in global development programs and technology in our upcoming online course on Gender.

Use the coupon code, IWD2015, by this Friday, March 13, to get $50 off any TechChange open online course such as mHealth, Mobiles for International Development, Gender, and more.


We are proud to announce that TechChange now runs on 100% pollution-free electricity as a Arcadia Power Clean Energy Partner. With our partnership with Arcadia Power Clean Energy, TechChange now meets the Environmental Protection Agency’s (EPA) Green Power Partnership requirements, joining businesses like Whole Foods and Google who also run on clean energy.

As a registered Certified B Corps social enterprise, our focus as a company goes beyond just creating a market-driven, financially sustainable business, but also trying to make a positive impact on the world. Since 2012, being a ‘triple bottom line’ business that measures its success in terms of “people, planet, and profit” has been an important part of what guides our business that has reached over 2500 alumni in over 100 countries to date. Every day, we’re inspired by how our community is using technology and skills training to address some of the world’s biggest challenges such as mitigating climate change, containing emerging infectious diseases like Ebola, promoting peace in conflict zones around the world, rebuilding communities struck by natural disasters, and more.

Today, we’re excited to share how we’re doing our small part to impact the environment with our partnership with Arcadia Power. While most of us at TechChange walk or bike to work, we saw an opportunity to further reduce our carbon footprint by supporting local wind and solar projects through a national clean energy provider. In doing so, we are helping to reduce America’s dependence on fossil fuels and support renewable power and local green jobs.

As a fellow B Corps business, Arcadia Power couldn’t have been a better partner to help us make this transition. And we are happy to learn that the feeling is mutual.

We’re excited to be partnering with a company that truly exemplifies the responsible practices we all want from businesses in our communities,” said Arcadia Power co-founder, Ryan Nesbitt. “As a fellow Certified B Corps, TechChange adheres to the highest social and environmental standards, and choosing clean energy is a great step in reducing their impact and doing their part to combat climate change.”

Have any ideas about how we could further reduce our carbon footprint? What are some of the ways your business is going green? Tweet us @TechChange or let us know in the comments.

About Arcadia Power
Arcadia Power is the first nationwide Clean Energy option. By partnering with wind and solar projects, Arcadia Power provides homes and businesses with 100% pollution-free energy via local utilities. Members support their values through their monthly energy bills, decreasing demand for fossil fuels and helping to grow American green jobs and power. Arcadia Power partners with sustainability-minded companies and organizations to combat climate change and secure a better future for our planet.

What are tangible ways to promote peace in local communities? How can peacebuilding practices effectively spread beyond borders? What are the best ways to encourage tolerance and responsible citizenship to avoid wars?

These issues are the focus of Generations For Peace, a leading global non-profit peacebuilding organization working to solve challenges and resolve conflicts around the world. Founded by HRH Prince Feisal Al Hussein and Sarah Kabbani of Jordan in 2007, Generations For Peace focuses on empowering youth by training young volunteers in sustainable conflict transformation so they can introduce peaceful practices and spread them throughout their communities. The youth volunteers then train others in conflict resolution practices with advocacy and empowerment training in the form of activities such as sports, arts, and dialogues.

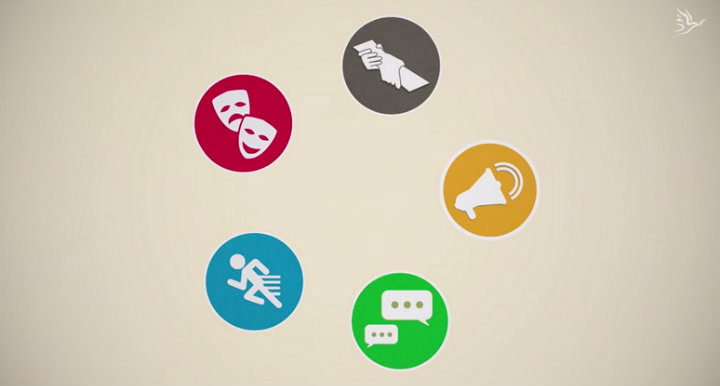
The five ways Generations For Peace empowers their youth volunteers around the world as portrayed in the animation

The five ways Generations For Peace empowers their youth volunteers around the world as portrayed in the animation

Storytelling via Animation
If a picture is worth a thousand words, an animation can tell a story that can propel people to action. After coming across TechChange’s animation for DME For Peace last summer, Generations For Peace approached the TechChange Creative Team to help tell their story of promoting peace through an animation.

Julia Kent, Director of Donor and Partner Communications at Generations For Peace, stressed that an animation was the perfect medium for telling their story. She emphasized that, “peacebuilding, and particularly sustainable peacebuilding via the Generations For Peace model, is a complex story to communicate. We felt an animated video would be an excellent medium to use in simplifying our story, and to show powerful and tangible visual examples of the work our volunteers do around the world.” The goal of the animation was to communicate this story of the powerful impact of youth volunteers sharing conflict resolution practices with others, carrying out their mission to “Pass It On” – ultimately urging viewers to take action by contributing their time, donation, or voice to GFP’s efforts.

We’re proud to announce the launch of our latest animation with Generations For Peace.

The Process of Visualizing Peacebuilding Practices
The Generations For Peace story is one of personal and community transformation, so the youth characters in the animation were vital in its storytelling. It was also important to have many diverse characters as well, to show the potential for peaceful conflict transformation to restore relationships between people of different backgrounds. The animation also needed to reflect Generations For Peace’s work in a variety of rural and urban contexts in 50 countries in the Middle East, Europe, Asia, and Africa. By understanding Generations For Peace’s vision for an animation, we used simple, papercut-style characters in the animation to be able to have a longer animation of 3:05 minutes with many different characters and activities to fully communicate their various vehicles for peacebuilding.

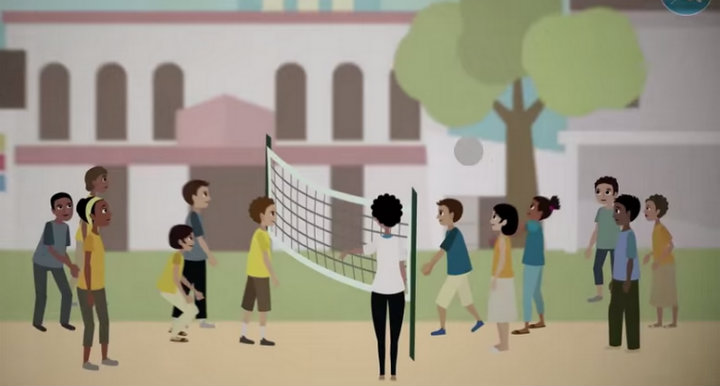
We used mixed teams of blue and yellow uniforms on each team (instead of one team of blue and another of yellow) to emphasize how GFP volunteers facilitate sports-based games that require cooperation between different groups as a medium for peacebuilding.

We used mixed teams of blue and yellow uniforms on each team (instead of one team of blue and another of yellow) to emphasize how GFP volunteers facilitate sports-based games that require cooperation between different groups as a medium for peacebuilding.

GFP’s guidance in reflecting their brand and communicating culturally relevant messages in the animation was crucial in coming up with a great final product. Julia also added that as this young organization is poised for another strong year of growth, they are excited to use this animation to reach more supporters and partners to support their mission. Organizations like Generations For Peace are doing very important work, and at TechChange, we help tell their stories in an engaging way, helping them communicate their story to a wider audience. We are excited to see Generations For Peace’s growth in the upcoming year!

Make sure to check out the ‘Pass It On’ video here, and let us know if you’re interested in sharing your organization’s story or a campaign by contacting the TechChange Creative Team at info@techchange.org.

In June 2014, we wrapped up the second round of our Mapping for International Development online course. Nearly 60 participants joined us from Rwanda, Ethiopia, Benin, Mozambique, Australia, Kenya, Haiti, Thailand, France and 10 more countries. They represented organizations like Oxfam, Korea NGO Council for Overseas Development, Chemonics, Danish Demining Group, Abt Associates, and many more.

Before we start our next Mapping for International Development online course on Monday, we took a look back at the previous round of the course. Here are a few things we learned together:

1. Learning to create a map is much more than learning about mapping tools

In this mapping course, the participants were introduced to mapping tools beyond just Google Maps Engine, like Tomnod, Crowdmap, OpenStreetMap, and many more. But before diving into the tools, we kicked off our mapping course with a lively discussion on an ongoing debate about the power of amateur cartographers in telling their story by mapping their own communities.

In a course with various levels of mapping experience, this discussion was definitely a highlight of the course. Tom Mueller, a GIS professor at California University of Pennsylvania, pointed out in the course that “all maps are telling a story.” And the discussions in this first week made clear the participants’ view that the communities being mapped should have the power to tell their own story, whether it means creating their own maps or choosing not to be on a map.

Some of the participants were being introduced to thinking about the ethics of mapping for the first time through this mapping course. Participants grappled with questions like who is or is not represented on a map, is a map biased, what story is a map telling, who made the map and why.

Mapping for International Development was much more than a class on how to use different mapping tools (for that, there are already many tutorials available online) but rather an excellent overview of the current debates regarding mapping for international development and current ongoing experiences.Fabien Maitre-Muhl, who works in the Community Violence Reduction section of UN Stabilization Mission in Haiti

2. The best maps require collaboration

Like the global digital mapping community, the participants and guest experts learned from each other in this mapping course. Nine guest experts joined us from OpenStreetMap, Tomnod, Ushahidi, GIS Corps and other organizations that crowdsource the talent of mapping volunteers to create better maps. The active engagement of almost 60 participants amongst each other and the guest experts made the four weeks of the course a great learning experience for everyone.

After the first week, we discussed the different tools used to create maps, and participants had a chance to share the maps they were working on. They were able to see each other’s work and find ways to collaborate and learn from each other’s experience. Tom Mueller’s final project for the course was creating a mapping project for his students where they used social media to map ongoing crises around the world. He created the project by getting feedback and suggestions from the other participants in the Mapping for International Development course.

“Thanks to all the other course participants. There were some really interesting posts in the forums and obviously some fascinating and important development and humanitarian work is going on around the globe. The course certainly raised my awareness about the role that mapping can play in this work, as well as the kinds of barriers and challenges that mappers have to negotiate in a range of social situations.” – Gary Scott at Australia Central Land Council

“I have effectively learned how to create an interactive map using tools such as QGIS and TileMill starting from nothing thanks to this course.” – Mattia Zanazzi at the UN Stabilization Mission in Haiti

3. Mapping makes the invisible visible

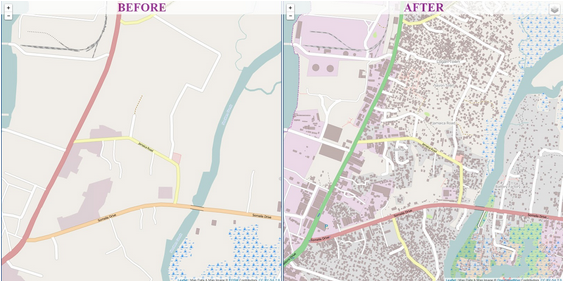
Fabien Maitre-Muhl, one of the course participants noted that, “mapping helps make the invisible visible.” Increasingly, digital mapping is becoming important in expediting humanitarian response as it is crucial to reach the population most affected by crisis in the most remote areas. During the Ebola crisis, OpenStreetMap helped map the affected areas to make tracing the outbreak easier.

Monrovia OSM pre-Ebola

Map of Monrovia in OpenStreetMap before and after volunteers mapped the city in response to the Ebola crisis. (Humanitarian OpenStreetMap)

Mapping can also help visualize the impact of international development projects. Mira Gupta, a TechChange alumna from the previous Mapping course “used election maps to illustrate to [her] research team that once geocoded there might in fact be very distinct geographical trends in the data” for a maternal and neonatal health qualitative study.

The last Mapping for International Development online course introduced the participants to various mapping tools, and more importantly, facilitated engaging conversations among people with varied levels of expertise from all over the world, and helped them get a better sense of the mapping needs and impacts for projects they were working on.

More than two dozen participants from 13 different countries have already enrolled in our upcoming Mapping for International Development online course, representing organizations such as Oxfam, Deloitte, Helen Keller International, United Nations, International IDEA, Vera Solutions, PwC, and more!

You can join us too! Sign up today for our Mapping for International Development online course, that begins Monday, March 2.

How can mapping the geolocations of tweets tell a story about global atrocities? How can digital mapping be integrated as a learning tool for university classes?

As part of his final project for TechChange’s online course, TC141: Mapping for International Development in Spring of 2014, GIS professor Tom Mueller wanted his students to explore these topics. In Professor Mueller’s course, “Introduction to Geography” at the California University of Pennsylvania in Pittsburgh, he had his students look for patterns in social media during humanitarian crises such as Ebola outbreaks and conflict casualties, and visually display the spatiality of those events.

Throughout the semester, Tom held several discussions with his students on various topics using social media to map out crises. In his course’s final assignment, Tom had about 100 students in the geography class work in groups to map various Sudan/South Sudan incidents by following several Twitter handles and categorized tweets. After examining their papers, he decided to ask them to choose a country and possibly use CrisisNet as several students became more concerned about gathering tweets rather than the information itself. He felt students would take more ownership of their projects if they independently selected their country, region or topic of choice. So, he is having them search topics on CrisisNet to understand the information that can be part of a tweet. Subsequently, they will examine some news sources and choose a country, topics, etc.

We sat down with Tom Mueller to learn more about incorporating digital mapping into his university class.

1. What is your background in mapping? What interested you in taking TechChange’s Mapping for International Development class?

I have been a GIS professor at a small school just southeast of Pittsburgh called California University of Pennsylvania. I read about crisis mapping and wanted to learn more. When I read about TechChange’s Mapping for International Development online course, it seemed like a great way to acquire more knowledge.

2. What were the most useful tools that you became familiar with in Mapping for International Development online course? How are you applying what you’ve learned in the class?

The two most important tools I found to be useful were MapBox and CrisisNet. While I encouraged my students to use ArcGIS Online in my course, learning about MapBox and its use cases helped me see the connection. It made me realize that this type of project could work with an introductory class with no GIS experience since all we needed was
latitude and longitude of the location. This may sound silly, but after going through it on MapBox, I thought I can do this in ArcGIS Online.

Now I know I should have realized it before but going through the process let me step back and understand the power this project might have on the students.
Hopefully, they understand the power of location, social media, etc.

The most important aspect of the Mapping for International Development course was the feedback from the global class participants and TechChange instructors. It was their discussions that helped me design the project guidelines to let students follow certain Twitter accounts to gather information and attempt to investigate locations based on those tweets.
All the topics we discussed in the TechChange online course helped me to understand the beginnings of this type of geographical analysis and build my ideas. As I started formulating my ideas, I could put this information on the discussion board and the TechChange course participants would give me their comments, and suggestions or ask questions. All this information allowed me to build my university class project from the ground up for my own students.

An ArcGIS map produced by one of Tom Mueller’s students indicating the locations of early Ebola incidents.

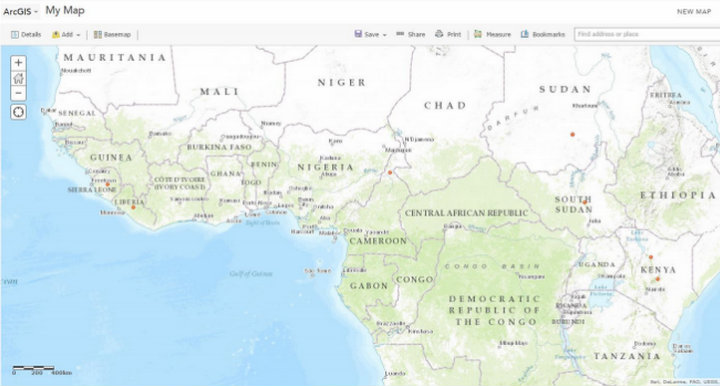
An ArcGIS map produced by one of Tom Mueller’s students indicating the locations of early Ebola incidents.

3. What inspired you to create this digital mapping exercise for your university students?

In my “Introduction to Geography” class at California University of Pennsylvania in Pittsburgh, my students and I examine geography through a global and regional lens. Sometimes geography might not be the most attractive topic for students, so I needed a hook to pique their interest. Humanitarian issues and genocide seemed to catch the students attention the most. I also knew that the situation in Sudan / South Sudan was active and the students would be able to get a lot more current information from Twitter than other sources.

4. How did your students respond to the digital mapping exercise? What were the results?

My students really enjoyed the assignment as it allowed them to learn about an unfamiliar part (at least to them) of the world. A few students said they could not believe the issues in this area since it did not seem that the popular media was covering the events. If I include a digital mapping exercise again in future classes I teach, my only change would be to may let them choose a developing country and use CrisisNet as their data source. Then they would present their findings to the rest of the class.

5. What is your advice for other professors looking to incorporate digital mapping/blended learning (offline +online) into the courses they offer at universities?

Professors need to be flexible when experimenting with new technology tools in the classroom. For this project, we changed our plans slightly about three times based on conversations with the students and events around the world. The key for my class was not to write a “thesis”; it was for students to understand the power of social media during crises and the spatiality of those events.

About Thomas Mueller

Tom-Mueller

Dr. Thomas R. Mueller is a professor at the Department of Earth Sciences at the California University of Pennsylvania and an alumnus of TechChange’s Mapping for International Development online course. His research agenda has grown dramatically throughout his career at California University of Pennsylvania. He applies spatial theory to the real world, particularly using Geographic Information Systems. His key to building a successful research agenda is to produce work through a variety of scholarly endeavors, including conference presentations, grants, technical reports, book reviews and publications in professional journals. He also has taught numerous GIS workshops for members of the local community, professors at Cal U and other campuses, and for the K-12 community.

Interested in learning different digital mapping tools for the context of humanitarian crises around the world? Enroll now in our upcoming Mapping for International Development online course.

Applying technology solutions to the challenges of international development requires organizational change more than new gadgets. That’s why we were thrilled to launch our new Organizational Guide to ICT4D at the NetHope Fall 2014 Summit in Silicon Valley.

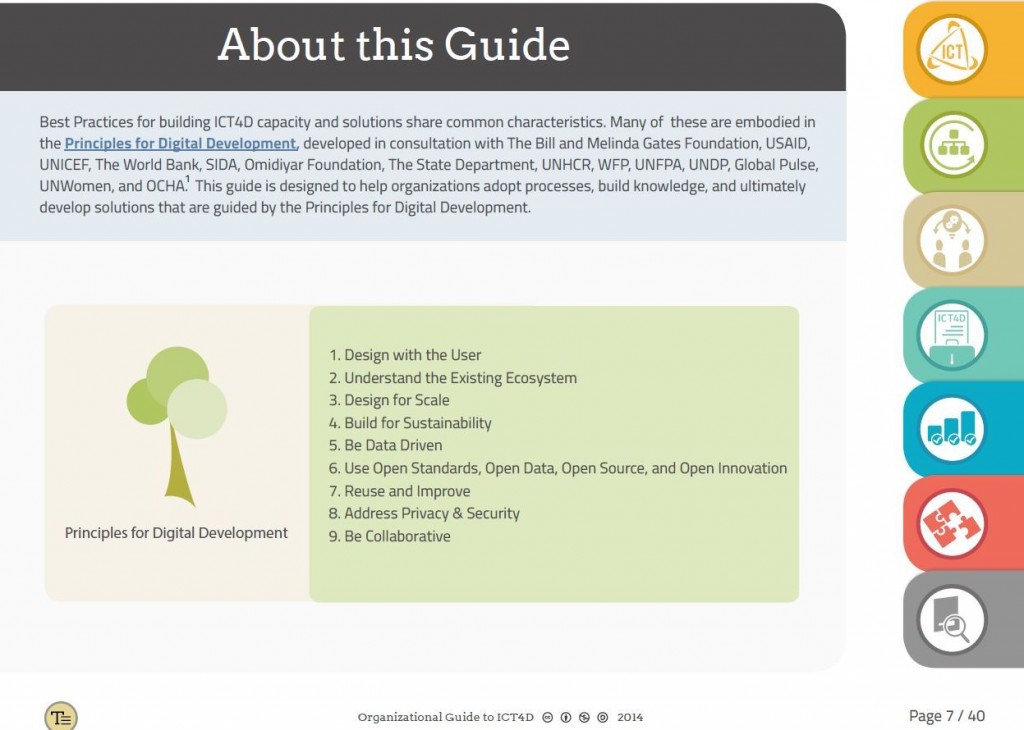
The Organizational Guide to ICT4D has been developed in partnership with NetHope, CRS, Microsoft, and HC3, with content shaped by the Principles for Digital Development, and design considerations by the PATH Toolkit for Public Health Managers. Our hope for the guide, which is under consideration for publication under a Creative Commons License, is that the nature and delivery of the publication will be as influential as the content itself.

But what decisions were made to create the new guide?

Lesson 1: Embrace Digital-First Media

Even though mobile-first design has been embraced for online presence, print-first design still reigns supreme for publications in international development. This is partially because the government has been driving industry adoption, but also because PDFs 1) deliver an exact representation of the original document, 2) provide a consistent user experience across platforms and printers, 3) are freely accessible, and 4) can be distributed to low-bandwidth environments.

But that doesn’t mean that you have to design a PDF primarily for offline use. Once you free your publication from the constraints of paper, you can more freely adopt richer colors free from printing requirements, additional external information via hyperlinks, regular updating for rapid iteration, and of course — clickable navigation to easily browse the document.

 Org Guide Screenshot

Lesson 2: Design for Social Distribution

But just because your PDF exists in a digital format, doesn’t mean it will actually be read. According to a May 2014 internal study by the World Bank (available in PDF), nearly one third of reports have never been downloaded. And of those downloaded, how many would you expect to be read in full by their target audience?

The nature of text-heavy, long reports discourages sharing what could be hailed as mission-critical information. But visual information alternatives can be easier to understand and share, especially when used with interactive aids to jump around the content. If you were travelling to a new city and brought a guide book, would you want dense text or an easily navigable companion?

 Org Guide Screenshot 2

Lesson 3: Help Others Repurpose Your Content

We were fortunate in designing this guide to do so in partnership with organizations committed to NetHope’s mission to act as a catalyst for collaboration for applying common technologies. As such, we wanted the document to be a space to share experiences and thoughts, not a one-way declaration of expertise. By including photos and quotes, we hoped to not just include voices from the field, but to provide a personal relevance and connection on technical content.

But what would we do if we weren’t updating fast enough, or covering in enough depth important topics to our community? How could they take what we had done and make it relevant to their daily tasks? Fortunately, with a Creative Commons licensing approach, we want to signal that the purpose of this document is to be shared, critiqued, dissected, repurposed, and reassembled.

Interested in learning more? We hope that you’ll download the guide and join the conversation.


Liang Cai recently joined TechChange as the Creative Director. Liang is a Motion Designer, Animator and VFX compositor. He specializes in 2D/3D motion graphics design as well as combining animation and live action video into visual storytelling.

Liang has worked both in Washington, DC and New York on various feature films, TV shows and commercials. His past experience includes works for 2011 Sundance-winning Film Another Earth, Fox Searchlight feature film i Origins, MTV show True Life: I’m Polyamorous and 2014 Democratic National Campaign commercials. Liang graduated from Peking University, China with a BA in Film & TV Production and holds a Master Degree in Film & Media from American University, Washington DC.

Welcome to the TechChange team, Liang!

PreMAND field workers testing data collection tablets in Navrongo, Ghana (Photo: N. Smith)

Mira Gupta, one of the star alumna of our courses on Mapping for International Development and Technology for Monitoring & Evaluation (M&E), is a Senior Research Specialist at the University of Michigan Medical School (UMMS). Last October, USAID awarded UMMS $1.44 million to assess maternal and neonatal mortality in northern Ghana. This 36-month project, “Preventing Maternal and Neonatal Mortality in Rural Northern Ghana” (also referred to as PreMAND: Preventing Maternal and Neonatal Deaths) will help USAID, the Ghana Health Service, and the Ghana Ministry of Health design interventions to prevent maternal and neonatal mortality by investigating the social, cultural and behavioral determinants of such deaths across four districts in northern Ghana. For this project, UMMS will be partnering with the Navrongo Health Research Centre and Development Seed.
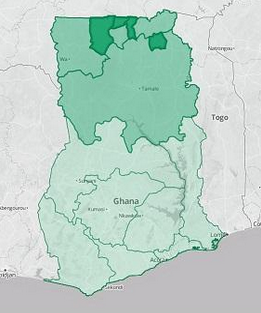
Project Regions and Districts

Project Regions and Districts

We sat down with Mira to learn more about this project and how her TechChange trainings in digital mapping and technology for M&E gave her the skills and background she needed to develop her team’s project in Ghana.

1. What interested you in taking the Mapping for International Development and the Tech for M&E online courses?
I was in the process of trying to learn everything I could about our GIS options when I heard about TechChange’s Mapping for International Development course. It provided a fantastic introduction to the range of approaches being used on international development projects and the variety of organizations working in that space. The course material helped me identify which types of visualizations would be most appropriate for my team’s research. I especially benefited from the many sectors represented in the TechChange sessions because while I was trying to create a project for the Health sector, I actually learn best through a Democracy and Governance framework given my previous background in this field. TechChange provided access to mapping specialists in both areas through its instructors and other class participants.

Just as I heard of the mapping course right as I needed it, the same thing happened again with the Technology for M&E course, which I took a year later. By that point, the PreMAND project had just been awarded and I learned that I would be responsible for the evaluation components. I was excited to take the TechChange course because I knew it would provide a great overview of the many different tools being used, and that I would benefit immensely from the participation of classmates working on projects in similar settings. As expected, the content presented was incredibly valuable in informing our project approach in terms of our field data collection, methods of analysis, and presentation of findings.

2. How did the mapping component of this USAID-funded project come together?

The Three Project Phases: Research will inform the visualisations, which will inform programming

The Three Project Phases: Research will inform the Visualisations, which will inform Programming

While working on a maternal and neonatal health qualitative study a couple of years ago, I sensed that there were themes and patterns in the data that were difficult to verify since the locations of the respondents had not been geocoded. Some of the variables indicated 50/50 probabilities of any particular outcome, which seemed to suggest that there was no pattern whatsoever when viewed as a large dataset. Because my background is in Democracy and Governance, I used election maps to illustrate to my research team that once geocoded there might in fact be very distinct geographical trends in the data, drawing parallels to the locational breakdown of political party support in the United States.

I was in the process of researching mapping resources when I first heard about the TechChange’s Mapping for International Development course, and through the course I met some of the mapping experts that ultimately served as key resources in the development of our project strategy. The course gave me the necessary base knowledge to effectively liaise between our health researchers and the mapping experts to determine the best approach to meet our data visualization needs. We were extremely fortunate to have USAID-Ghana release a call for outside-the-box submissions under its Innovate for Health mechanism, right as we were developing our program concept.

3. What are the biggest challenges you anticipate in undertaking this project?
For the visualization component, generating the base layer maps will be more difficult than we originally anticipated. The various pieces of data we need are spread throughout different government sources such as the Ghana Statistical Service, the Lands Commission, and the Ministry of Roads and Highways. We will need to consult with each of these groups (and likely many others), to explore whether or not they will allow their data to be used by our project. It will require some agility on our part, as we need to stay flexible enough so that we collect any outstanding geographic data we may need through our team of field workers. While there are many moving pieces at the moment, it’s exciting for us to think that we’re building what may be the most comprehensive geographic base layer map of the region, as an initial step in developing our health indicator analysis tool.

There are also a handful of challenges related to evaluation. The primary purpose of our project is to provide new information to clarify the roles of social and cultural factors in determining maternal and neonatal deaths, and shed light on a valuable set of drivers which up until now have been unclear. We are currently in the process of finalizing our M&E framework, which has been a complex process because our project doesn’t fit the mold that most performance indicators are designed for. As a result we’ve been carefully drafting our own custom indicators through which we’ll measure our project’s progress and impact.

One of our most interesting evaluation challenges has been the development of our Environmental Mitigation and Monitoring Plan, which is traditionally intended as a tool for implementing partners to take stock of the impacts their work could have on the natural environment. In our case, we’re using it as a tool to think through our ethical approach to the potential impact of our project on the social and cultural landscape, given the challenges associated with collecting very sensitive health information and the need for data privacy. It’s pushing our team to think through every step of our project from the perspective of our various stakeholders, and has yielded many valuable insights that have strengthened our program approach.

4. What are the tools that you became familiar with in Mapping for International Development and M&E and plan on using in this project and how will you apply them to your project?
I came into Mapping for International Development knowing very little about the resources available in that space. Several of the tools that I became familiar with through the class, such as OpenStreetMap, MapBox and QGIS were highly applicable to our project in Ghana. After participating in the session led by Democracy International and Development Seed, I reached out to those instructors for their input on how I could best translate my project concept into actionable steps.

The visualizations I hoped to create were complex enough that I soon realized it would make the most sense for our research team to work directly with a mapping firm. We were so impressed by the technical feedback and past projects of Development Seed that we established a formal partnership with them and worked together to refine the vision for the project that was ultimately funded. TechChange’s training gave me the knowledge I needed to select the right partner and understand how best to combine our research goals with the available mapping resources to maximize our project’s impact.
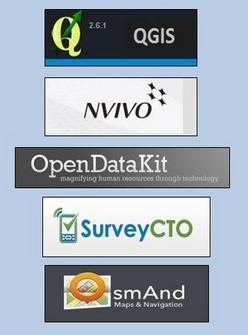
Programs used on the PreMAND project

Programs used on the PreMAND project

In Technology for M&E I learned about the capabilities of different devices, survey apps—those able to capture geodata were of particular interest to me—and even project management tools. There were many helpful conversations both in the class sessions as well as in the participant-led threads around the data collection process, data privacy, and the ways in which project findings can be best communicated to a variety of stakeholder groups. What I found to be most relevant and applicable to our Ghana project were the conversations surrounding human-centered design, and the use of rich qualitative data. I gained a lot from the session led by Marc Maxson of GlobalGiving, who discussed which forms of data are the richest and easiest to interpret. The University of Michigan and our partner the Navrongo Health Research Centre already excel in qualitative data collection techniques, but the conversations throughout the TechChange M&E course inspired some new ideas as to how we might incorporate multimedia such as video and photographs in our qualitative data collection process to make our project deliverables that much more substantive.

5. What is your advice for researchers working to integrate more data visualization and mapping in their research and project interventions?
My advice would be to focus on the end user of your data and identify their needs and interests early in the process. That clarity can then be used to inform 1) what content will be most useful, and 2) what presentation format(s) will be most effective. It’s important to do some form of a needs assessment and let stakeholder feedback guide the project’s design.

In the case of our Ghana project, we are implementing a two-prong approach to our visualizations because both the government representatives and our donor will find an interactive web application most useful, while local community members in the rural North will benefit more from group discussions centered around printed maps.
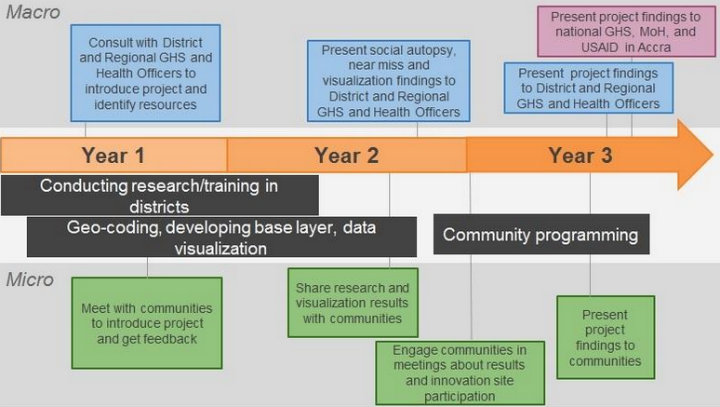
Feedback loop with two stakeholder groups: the government of Ghana and local communities

Feedback loop with two stakeholder groups: the government of Ghana and local communities

It is common to sometimes present health indicator data solely as points on a map, but we are designing our visualizations to be much more detailed with background layers including health facilities, schools, compounds and roads so that those viewing the health indicator data can orient themselves a bit better to the local context. Had our end-users only been the leaders of those individual communities such detailed maps may not have been necessary. Similarly, the visualizations for one stakeholder group might incorporate a lot of words or even narrative stories based on their level of education, while for other stakeholders, those visualizations will be more image-based and we’ll orient them to the maps through presentations in their local communities.

About Mira Gupta

Mira Gupta

Mira Gupta is a Senior Research Specialist at the University of Michigan Medical School (UMMS), where she focuses on program design, strategy and evaluation. She has developed successful international aid projects in 18 countries, including 13 in Africa. Mira began her career in the Democracy and Governance sector where she worked for organizations such as IFES, the National Democratic Institute, and the Carter Center. She also developed projects in the Economic Risk and Conflict Mitigation sectors before transitioning into Global Health. Her research on the effects of local power dynamics on health-seeking behavior in northern Ghana is published the current edition of Global Public Health.

Samita joined TechChange last summer and has returned this year as an EGLI – Atlas Corps Fellow. As a Communications Associate, she assists in the daily communications with TechChange’s domestic and international clients and marketing of TechChange courses, as well as maintaining the TechChange blog. During her trip to Nepal over the holidays, she visited some of TechChange’s participants at the GIZ office to learn about Nepal’s mHealth pilot and their experience with TechChange’s courses.

Before TechChange, Samita was assisting the refugee resettlement department at the U.S. Committee for Refugees and Immigrants. She holds a B.A. in History with minors in Social Policy and Global Economics from Goshen College. Samita is from Nepal and considers India her second home after spending seven years in boarding school there. In her free time, Samita enjoys finding the best local eateries in town and attending music events.

Welcome back Samita!

Last month in DC a commercially-available quadcopter crashed into the White House and brought new public interest into the regulation of drones. Only a week before the incident, the Department of Homeland Security held a conference open to civilians but explicitly closed to the press to demonstrate, among other capabilities, a similar quadcopter strapped to 3 pounds of inert explosive.

DJI, the China-based manufacturer of the drone in use, released a mandatory firmware update to geofence a 15.5 mile radius around downtown Washington, DC, only to ask users to roll back their update due to “unanticipated flight behavior.” Even if the update worked, it would only have been applicable to Phantom 2 models, and not the Phantom 1 that was used in the White House incident. While these efforts are a start, security experts are skeptical that such techniques would deter a terrorist.

But last week while national security was struggling with what to do with drones in DC, the first-ever Drones for Good Challenge in Dubai sought to “find the best uses of drones to public services and improving people’s lives.” After reviewing over 800 submissions from 57 different countries, the $1 million prize was awarded to Swiss company Flyability, for creating a “collision-tolerant drone” designed to enter hostile environments such as a burning building filled with smoke without endangering aid workers.

But how do we incentivize more drones for good and fewer drones for terrorism?

The Federal Aviation Administration is still struggling to finalize drone regulations after being ordered to do so in 2012 by Congress. But the concern among hobbyists is that rushing the regulatory process could create burdensome rules that hamper innovation. One solution is “regulatory sandboxing”, where some initial constraints are relaxed while rules are still being made, keeping a focus on public safety. The hope is that reducing the hidden costs of burdensome regulations will spur innovation here in the US. For example, Amazon is testing their drone delivery services in Australia due to regulatory opposition in the U.S.

But reducing regulations isn’t enough. Organizations such as the UAViators: Humanitarian UAV Network seek to support a global network of UAV hobbyists to share information and promote community engagement. Expanding that network further will be an effort in education as much as drone delivery. Digital Democracy, for example, helped a community in Guyana build a drone to map deforestation. But those efforts were coupled with the drones becoming something more. According to Digital Democracy’s Gregor MacLennan:

We didn’t want to just fly into Guyana and fly a drone over the local villages. Our interest was whether this technology could be something that can be used and controlled by the communities themselves, and become a tool of empowerment for helping them have more of a say in their own future. We wanted the Wapichana to be able to repair it themselves, fly it themselves, and process the images to use for their own means.

In blurring the boundaries between new technology, STEM education, and sustainable development, the language and endeavors of drones for development are aligning with another frontier in development: 3D printing. And no surprise, it’s already possible to dream of printing your own drone and drone parts. Voxel8, a company founded and run by several Harvard and MIT professors, just released a developer kit for 3D electronic-device printer shipping in late 2015.

As the frontiers of development become the present of implementation, regulation and education will continue to determine the boundaries of what is possible.