Green infrastructure hasn’t always been a priority in urban development. Now, more than ever, green spaces are an essential component of urban design to build healthy, livable cities, and urban planners have jumped onboard. They have started integrating green infrastructure, green spaces (parks and recreational areas), tree canopies, vertical green walls, and green roofs into urban environments. And they are doing it with the help of maps!
Geographic Information System (GIS ) and geospatial technologies are incredibly useful to plan, build, and monitor green infrastructure. Urban green infrastructure is not only important in building a fun and vibrant city, but also necessary for supporting resilient populations across an environment. Increased use of green spaces is associated to improve psychological well-being, physical activity and general public health of urban residents. As green spaces become important in city planning, it is crucial to be able to visualize them.
Some cities in the U.S already have green infrastructure on the top of their agenda.
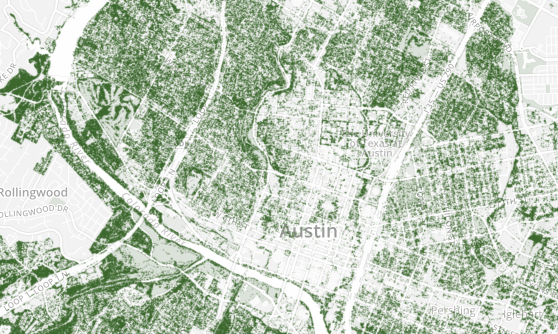 Nine cities that love their trees, via National Geographic
Access to green space; also an environmental justice issue
Though the benefits of greening a neighborhood are positive, they tend to increase property values and housing costs often pushing out or displacing traditional residents. According to researchers in the Landscape and Urban Planning Journal, “Most studies reveal that the distribution of [green] space often disproportionately benefits predominantly white and more affluent communities. Access to green space is therefore increasingly recognized as an environmental justice issue. Many US cities have implemented strategies to increase the supply of urban green space, especially in park-poor neighborhoods.”
Increased use of trees, especially in low-income housing areas has been shown to reduce noise pollution, filter air pollution and lower crime rates. Integrating trees along street sides of compact urban landscapes may improve environmental inequities.
While maps are only as good as their data (sometimes maps deceive the eye), they are a powerful tool in predicting and planning how cities grow. GIS and Remote Sensing go side by side in urban planning to help the decision-making process for new zoning laws, accommodate demographic changes and preservation of natural environments (wetlands, natural forests and rivers) on the border of new urban developments.
Here are three organizations who are already using maps to enhance green infrastructure in their cities:
1. Casey Trees
![]()
Casey Trees, a local non-profit organization based in DC has the mission to restore, enhance and protect the tree canopy of the nation’s capital by using GIS in their Research and Mapping programs. “We’ve compiled a map showcasing all of the nurseries within 25 miles of our headquarters in the District, Maryland and Virginia. These nurseries and garden centers have plenty of trees waiting for you to come claim them”
2. Green Roofs for Healthy Cities
![]()
Green Roofs for Healthy Cities- North America, is a not-profit association with the mission to develop and protect the market by increasing awareness of the economic, social and environmental benefits of green roofs, green walls and other forms of living architecture. Green roofs increase urban biodiversity through the attraction of pollinators (birds, bees and hummingbirds) and reduce hotter city temperatures caused by the heat island effect.
3. New York Restoration Project (NYRP)
![]()
New York Restoration Project (NYRP), is a non-profit organization driven by the conviction that all New Yorkers deserve beautiful, high-quality public space within ready walking distance of their homes.
“As New York’s only citywide conservancy, they bring private resources to spaces that lack adequate municipal support, fortifying the City’s aging infrastructure and creating a healthier environment for those who live in the most densely populated and least green neighborhoods.”
NYRP has a map initiative that compiles locations of parks, gardens, community spaces and tree plantings across New York’s five boroughs.
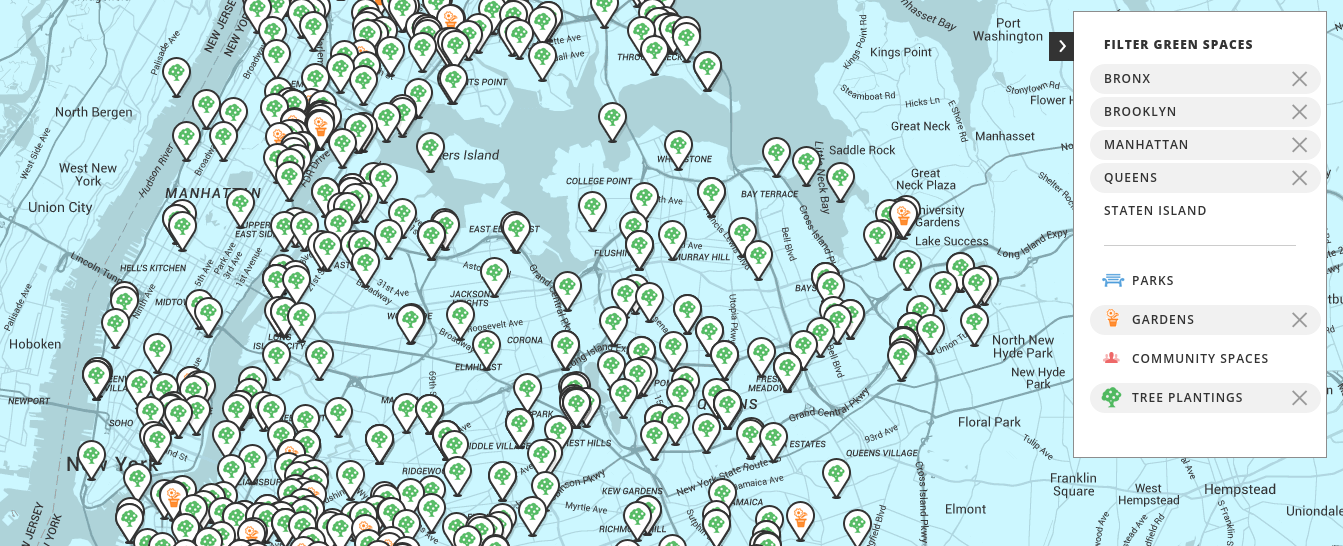
NYPR map that shows various green spaces in New York
Do you know of other organizations or individuals using maps to monitor green spaces in your city? Tweet at us @TechChange and @EvaAdler44 or comment below to join the conversation!
Interested in learning more about how mapping can be used for social good? Join Eva Adler in our upcoming course, Mapping for Social Good. Course begins on July 20!
About Eva
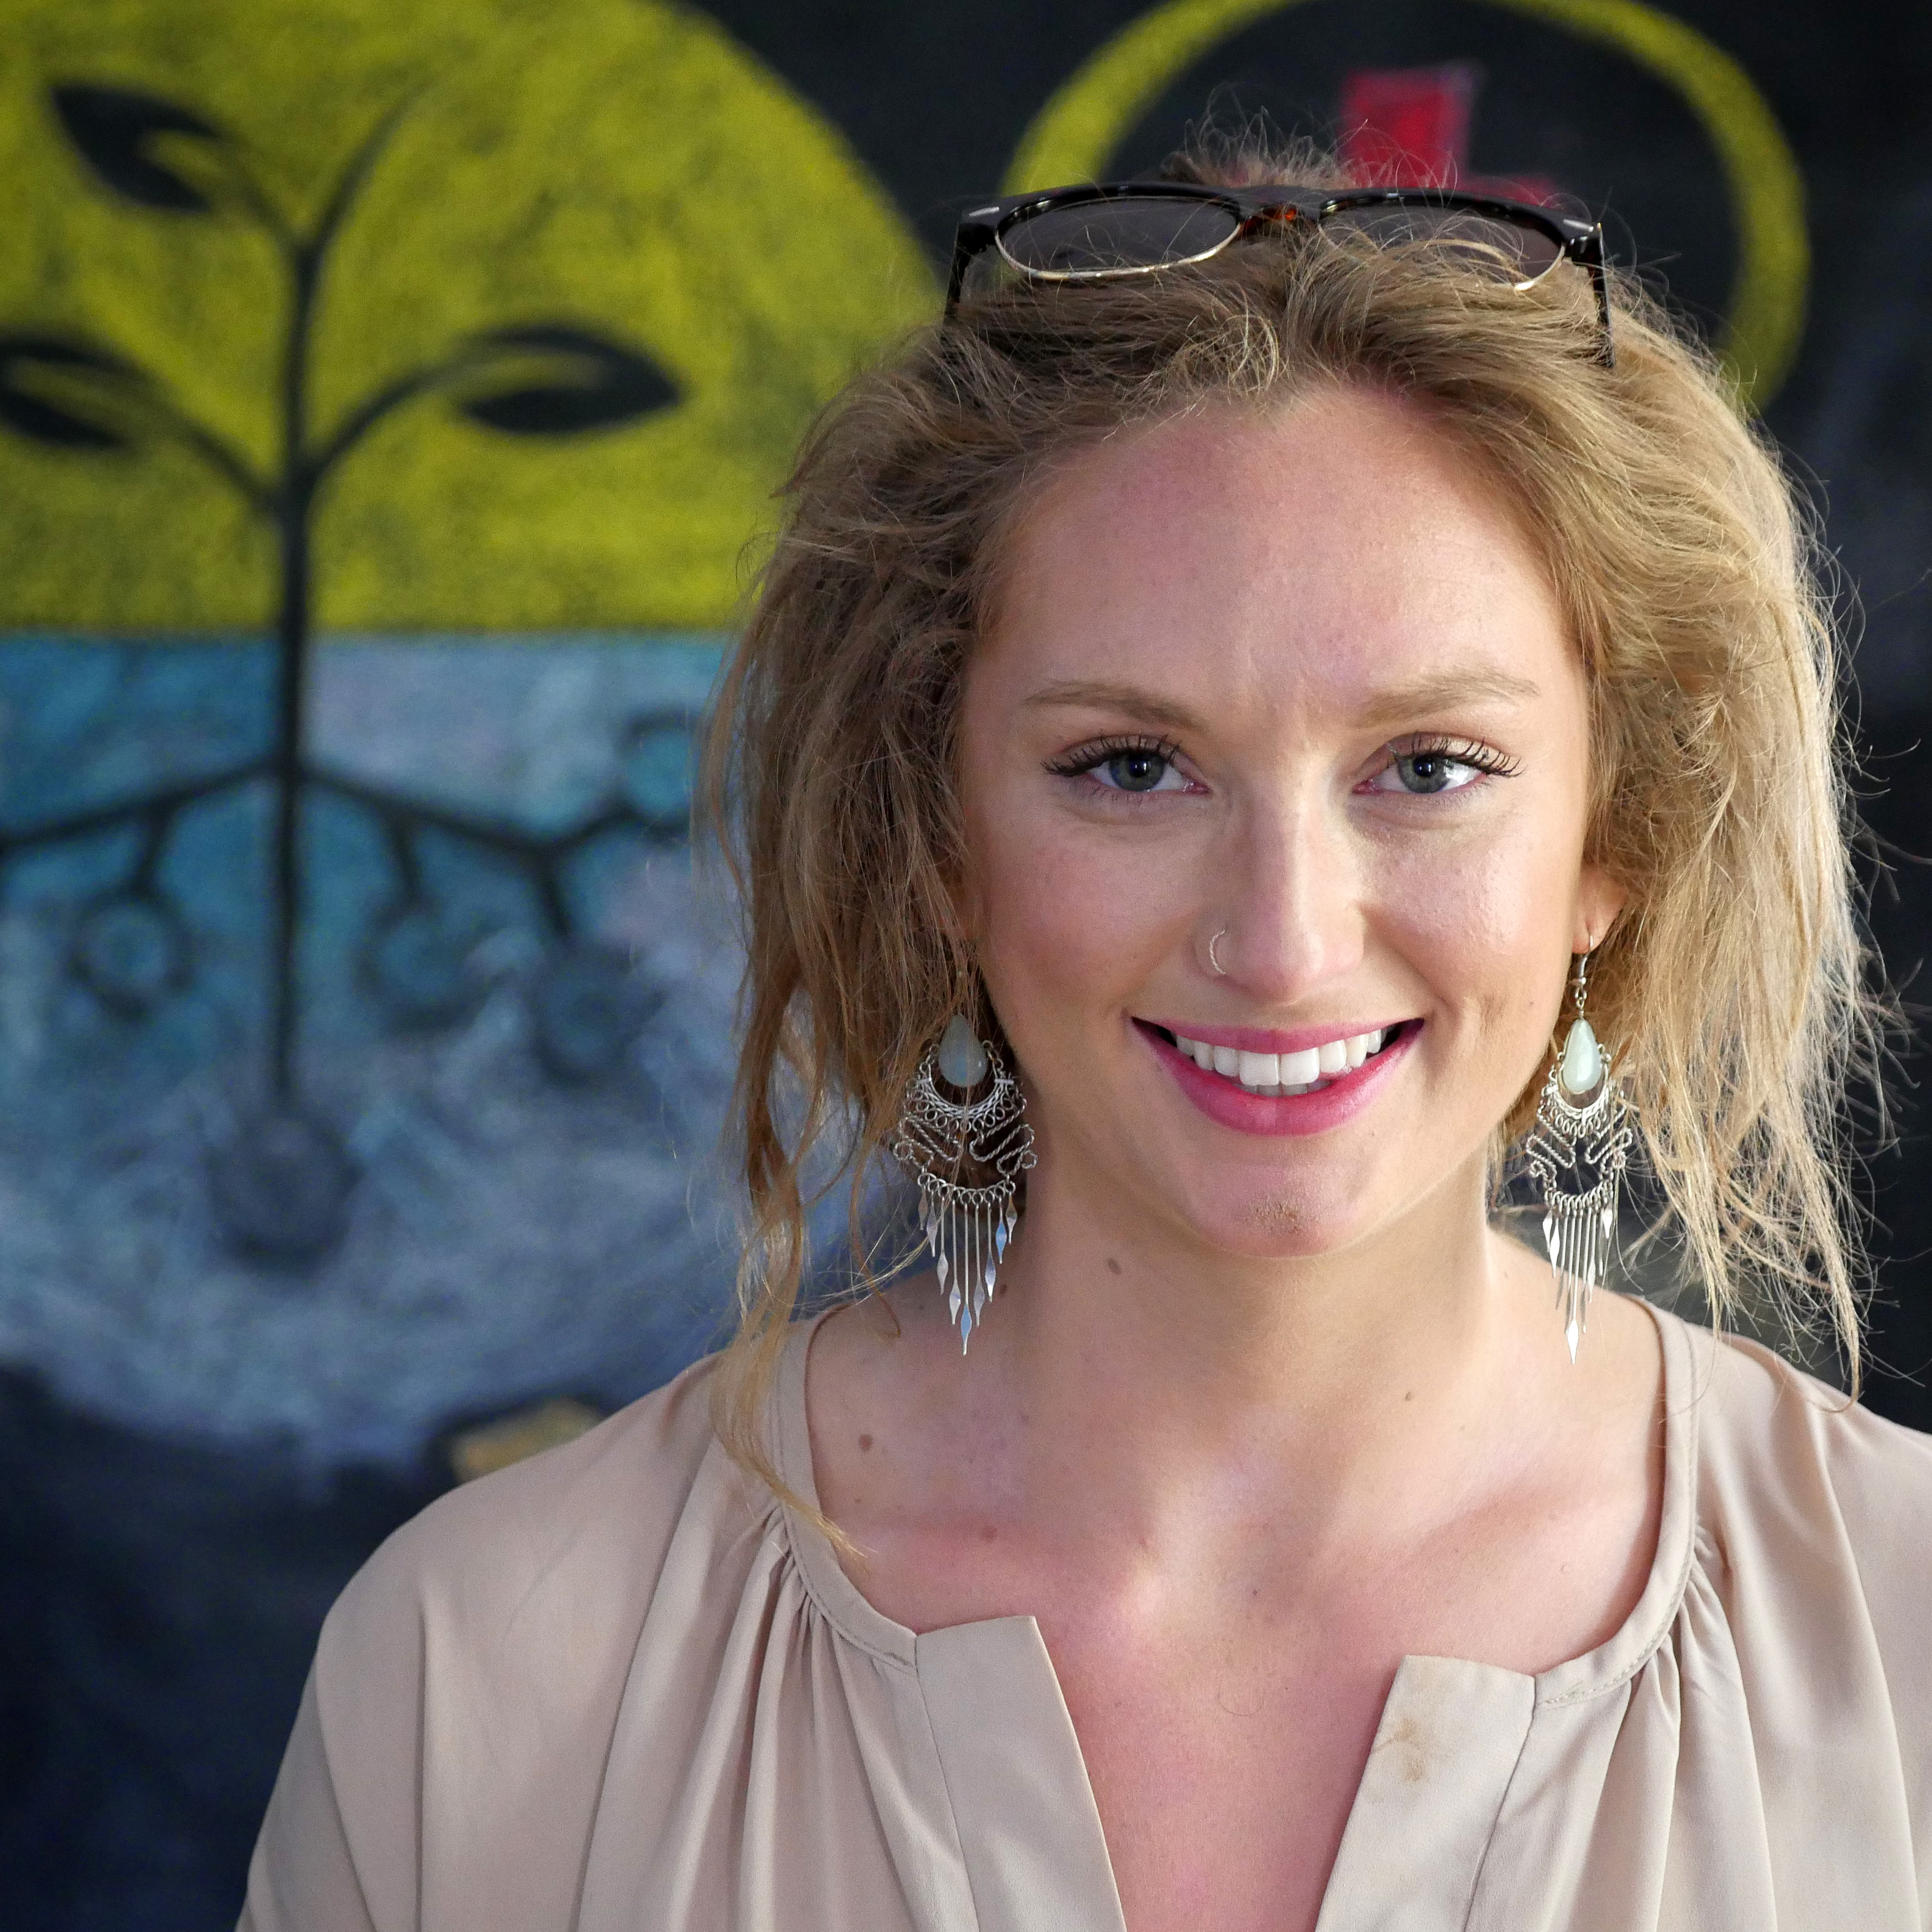
Eva Adler is the course facilitator for TC141: Mapping for Social Good. She enjoys exploring geovisualizations that act as platforms for global health and social equity movements. Prior to TechChange, Eva served on the Center for Innovations Team at R4D identifying innovative approaches to water and sanitation challenges across East Africa and India. She thrived conducting field work locally in South Carolina as a GIS Technician at Moore Farms Botanic Garden and in Colorado as a Research Field Assistant at Routt National Forest. Eva has worked in resource-limited environments gathering demographic, health and sanitation data alongside rural communities of Nepal. She holds a BA in Ecology and Geography with deep enthusiasm to collaborate with others who share the same passion for maps and social change.