Much of the event data that new technology is making available to practitioners contains geographic information, and to take advantage of this we need a way of thinking about geographic information in a predictive way. Combining today’s post with last week’s “Corralling the Data instead of the Data Corralling Us” post, we get a data filtering methodology that gives us data that is timely and geographically relevant in the field. This will set us up for next week’s post, which will explore how to use time and space filters to maximize the value of software like Swiftriver which significantly speeds the process of data collection and management for project leaders and analysts.
Imagine we’re in a public health setting and are looking at data on the outbreak of a disease in a locality. Since an event like a disease outbreak happens in a particular location, the first term we’ll look at is the…
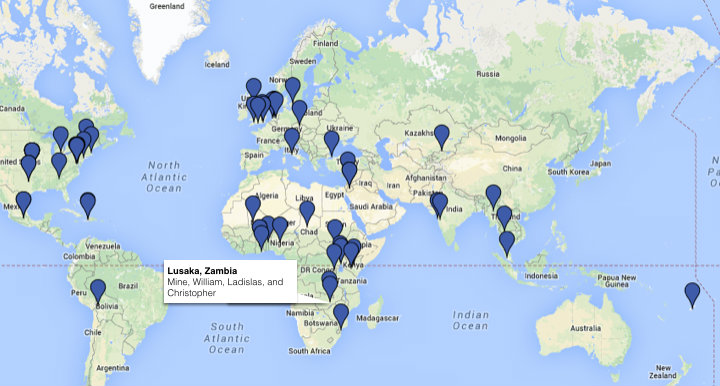
Point estimate: In geographic terms, our point estimate is the exact place (for example a village) that we hypothesize an event will occur. We derive our point estimate from our data; for example if a disease consistently breaks out in a particular village, we could hypothesize that the next outbreak of a disease is likely to occur in that village, as opposed to another village in the same district. We’ll make the latitude and longitude of the village is the point estimate.
So, here we find ourselves trying to prepare for a disease outbreak in the future. We have a point estimate, the longitude and latitude of the village in which we think the disease will break out, but we can’t be positive that the disease will break out in this village (it could break out in another). The more data we have, the more reliable our point estimate can become. This leads us to our next term, the…
Confidence interval: In data analysis and statistics there is no such thing as “right or wrong”. Instead, we focus on the likelihood of an event occurring at a particular place (our point estimate). The confidence interval frames the reliability of our data. When we have lots of good geographic data on an event (e.g. longitude and latitude of 700 disease outbreaks in a country for the last 15 years), we can more precisely predict the next outbreak’s longitude and latitude; if we don’t have a lot of data (e.g. longitude and latitude of only 20 outbreak events for one year) we can still estimate where the next outbreak will be, but not as precisely.
Now we have a means for deciding how broad the territory we should be looking at is, and how much data we need to collect. We can combine this with the method for filtering data based on our temporal needs to accomplish to important things when using technology and data to enhance our work in the field:
1) We have defined our needs, goals and limitations temporally and spatially. By doing this, we have recognized our own limits, are planning around what we believe we can accomplish and have defined what success looks like. Even if we never engage with technology, software or data, we have defined the goal of our work, and what we believe we need to know in order to achieve success.
2) Along with the broader value in defining our task and vision of success, we also have a means for collecting data that is relevant both temporally and spatially. We now have a means for telling filtering software like Swiftriver what it should be looking for, what it should be filtering out, and how it should be organizing the data.
As we can see, even if we never use technology in our fieldwork, a sound system of collecting and analyzing the data around us can make our project planning more effective. Since many of us are using computers in our operational contexts though, our next post will take the temporal and spatial approaches to data management and analysis and apply them to using filtering software like Swiftriver more effectively. By applying well founded data collection logic, next week’s post will begin to look at how technology can aid our efforts to affect positive change in the world around us.
Charles Martin-Shields has served as a consultant to the U.S. Institute of Peace, the Academy for International Conflict Management and Peacebuilding, and the Churches’ Center for Theology and Public Policy. He is currently completing a long-term study of educational development evaluation in conflict-affected settings to be published in March 2011 by the University of Toronto, and consults on project development and risk analysis in post-conflict settings. He can be reached at charles.martinshields@gmail.com.


