Is your organization trying to figure out how best visualize program or organizational data? Perhaps struggling to find the best tools to tell your stories better?
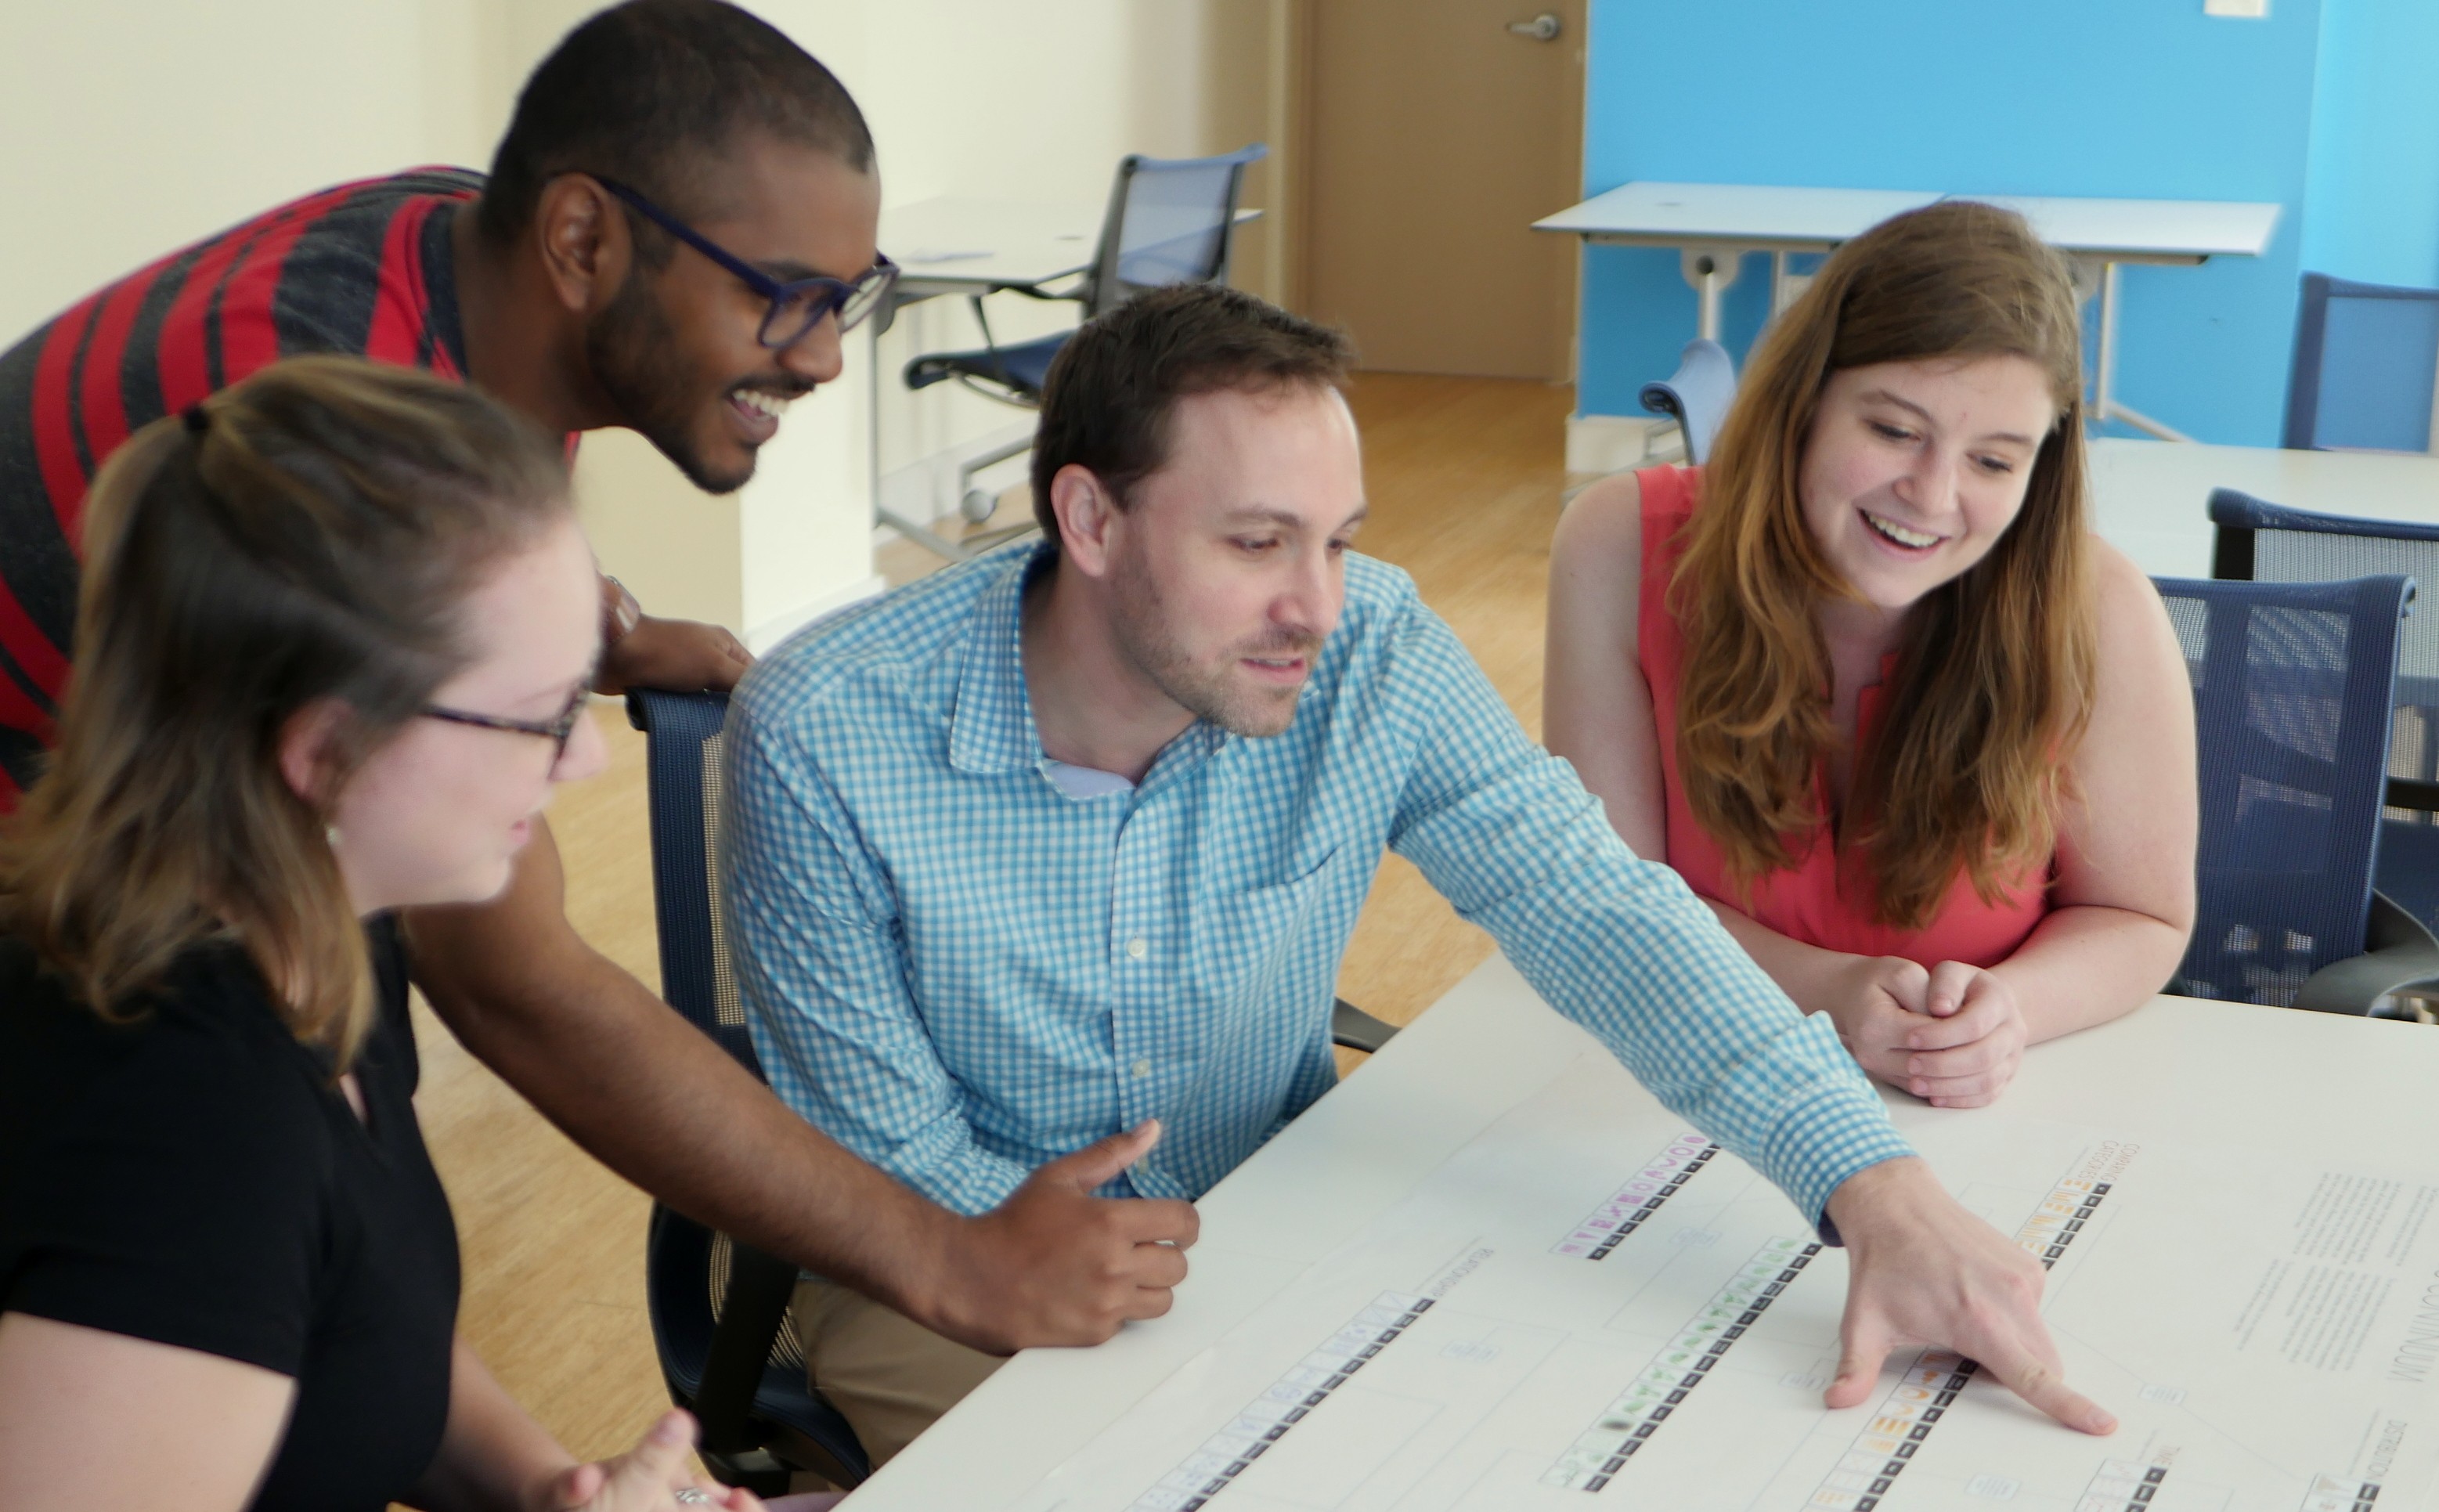
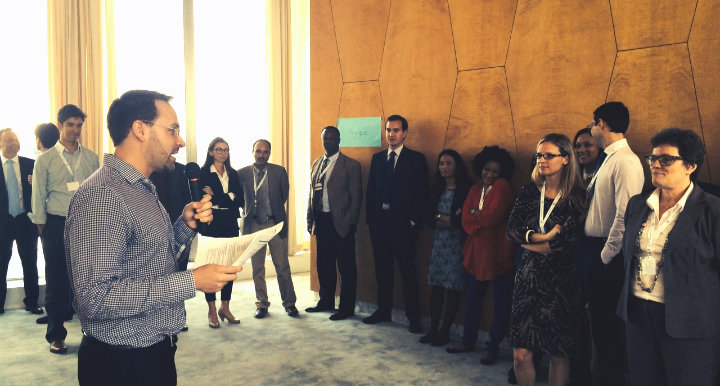
After two years of offering our most popular course Technology for Data Visualization, TechChange has decided to go off-line and create an in-person workshop on the topic. For those of you who are in the DC area, this in-person workshop offers a social, hands-on way to better understand data visualization.
The workshop is composed of three fundamental building blocks:
- Part 1: Building a foundation: Participants learn how to identify elements of successful (and unsuccessful) visualizations and are taught tips and best practices for designing effective products. Participants also explore popular theorists and practitioners of data visualization like Edward Tufte, Jonathan Schwabish, David McCandless and more.
- Part 2: Telling your story: Participants engage in a guided design workshop using their existing datasets & visualization ideas. Building a dashboard? Working on a donor report? Need to convince an audience of something? This interactive exercise helps refine and stage the story that you want to tell.
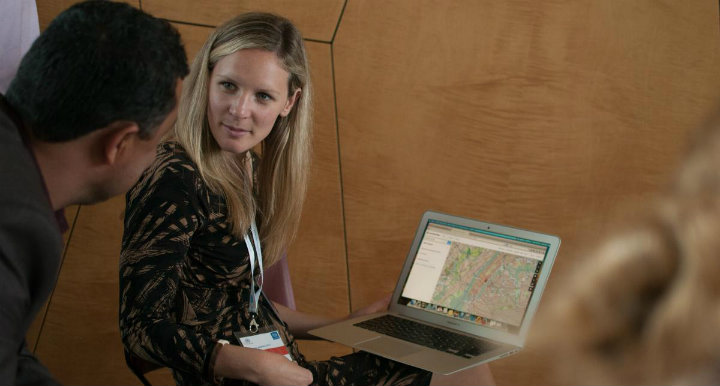
- Part 3: Learning new tech skills: Participants learn how to visualize their data in different platforms: Excel, PicktoChart, Canva and Infogr.am. Facilitators stage a series of mini-demos and exercises to do everything from cleaning and formatting data to building both static and interactive visualizations. This component includes basic exposure to additional tools like Tableau, CartoDB, and PowerBI for further exploration.
The workshops can be tailored with custom content and designed for a half-day up to a full week.
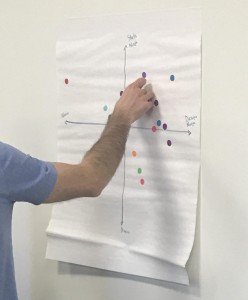
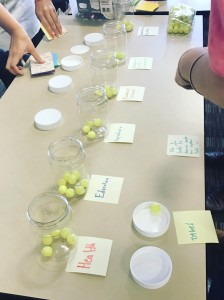
As part of the workshops we’ve included a number of hands-on interactive activities using human likert scales, balloons, ping-pong balls, stickers galore, emojis, neon hats and more. Plus, if you’re someone who likes to have someone to coach you through navigating a new software, we can provide you with that guidance in real time.
So far this year we’ve been busy facilitating workshops for Georgetown University, Jhpiego, Arabella Advisors, and more. Case studies and exercises have focused explicitly on examples like public health, water & sanitation, climate change, financial services for the poor, human disaster response but can be tailored to any sector or industry.
Sign up for one of our monthly in-person workshops at our new training space on 13th and U. St NW Washington DC, or write to us about doing a custom training at your organization on Tech for Data Visualization today. Workshops are offered on the following dates:
- Friday April 28, 2017
- Friday May 26, 2017
- Friday June 16, 2017

