TechChange convenes and connects the people
working across global health, AI, and social impact.
We help funders and organizations turn a product,
a standard, or an idea into a living community
that adopts it and carries it on.
Trusted by the organizations shaping global health, AI, and social impact


For fifteen years we've helped the world's leading organizations bring people together, teach them what they need to know, and keep them engaged long after a launch. We design and run the events, communities of practice, training programs, and campaigns that turn a good idea into a field that actually uses it — whether people gather in a room together, work through a course at their own pace, or join from a hundred countries online. And as AI reshapes how the world works, the human layer we build matters more, not less.
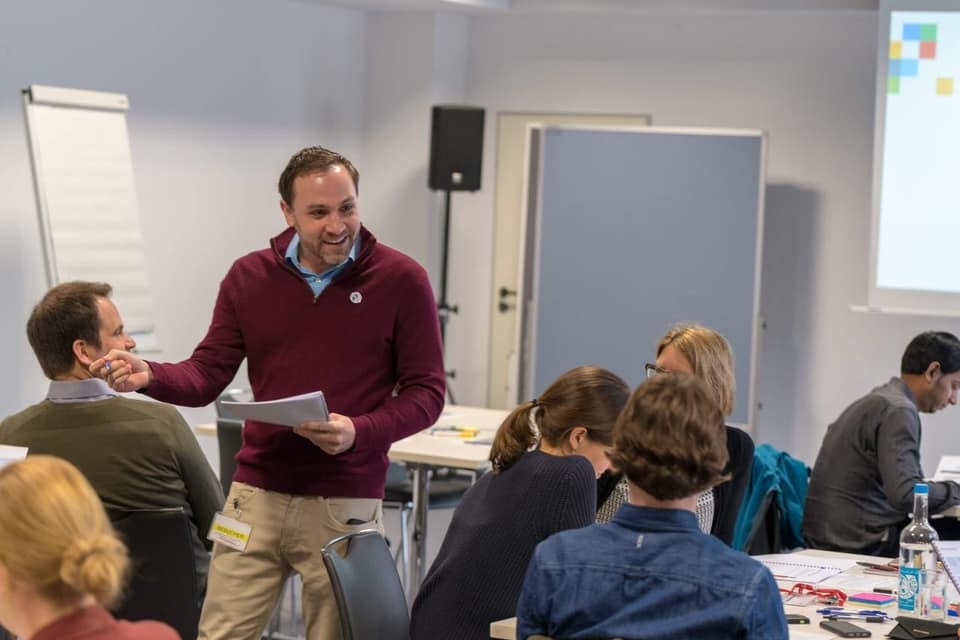
Conferences and gatherings, in person and online, that set a field's agenda.
Working groups and peer networks that keep the conversation going long after the conference ends.
Training of trainers, localization, and curriculum built into the programs and systems we run, so it's finished, not just started.
Turning a new standard or platform into something hundreds of organizations actually pick up and use.
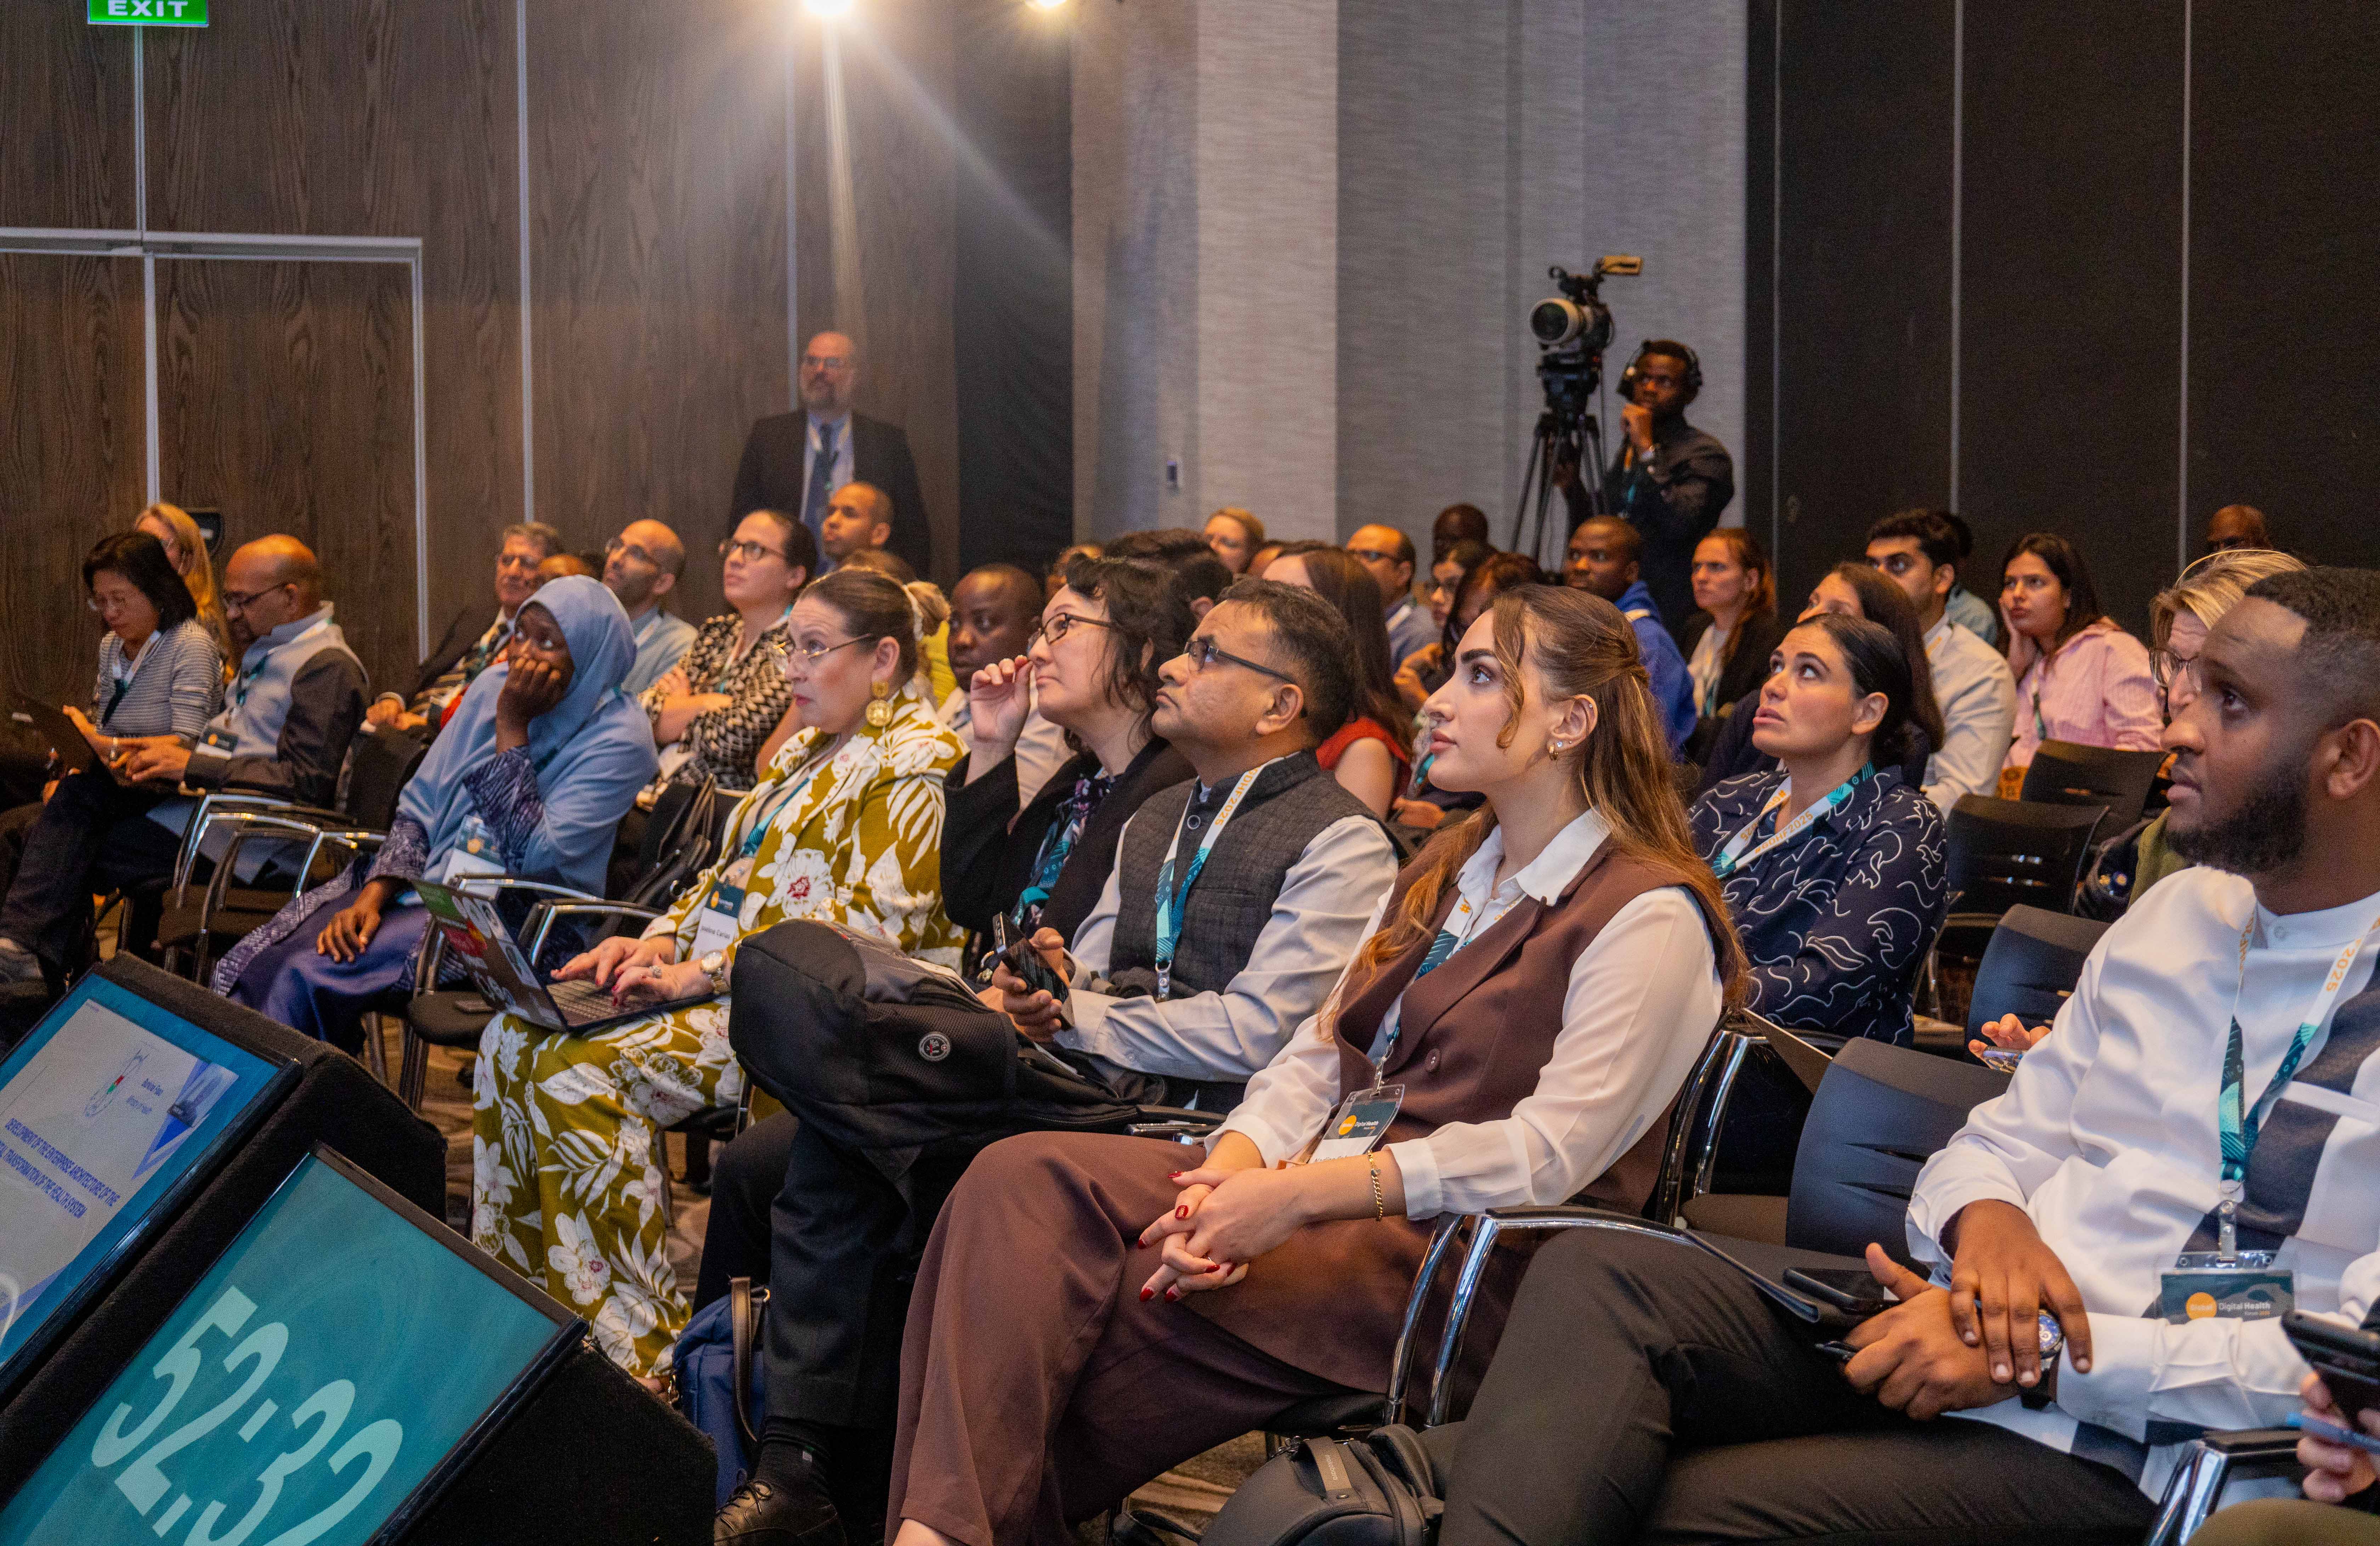
Our conferences are where the people leading global health and digital development set the agenda for the year — ministries of health, funders, and the practitioners and technologists doing the work. We run them end to end, in person and online: program, sponsorship, hybrid production, and the community that carries the conversation forward after everyone goes home.
In person and online. December 2–4, 2026, Bangkok.
Last year in Nairobi
In partnership with Catholic Relief Services.
Most organizations have digital ambitions bigger than their headcount... a platform to stand up, AI to put to work, a new way of working to roll out. We help you get there, and we build the community around it that keeps it alive after the launch. When you need specialized hands, we draw on a vetted network of digital specialists worldwide, so you get exactly the expertise you need, down to niche combinations of skill, geography, and language, through one relationship instead of a dozen contracts. And for governments, we help national planners and ministries change how they make decisions about digital health, through our Digital Health: Planning National Systems program.
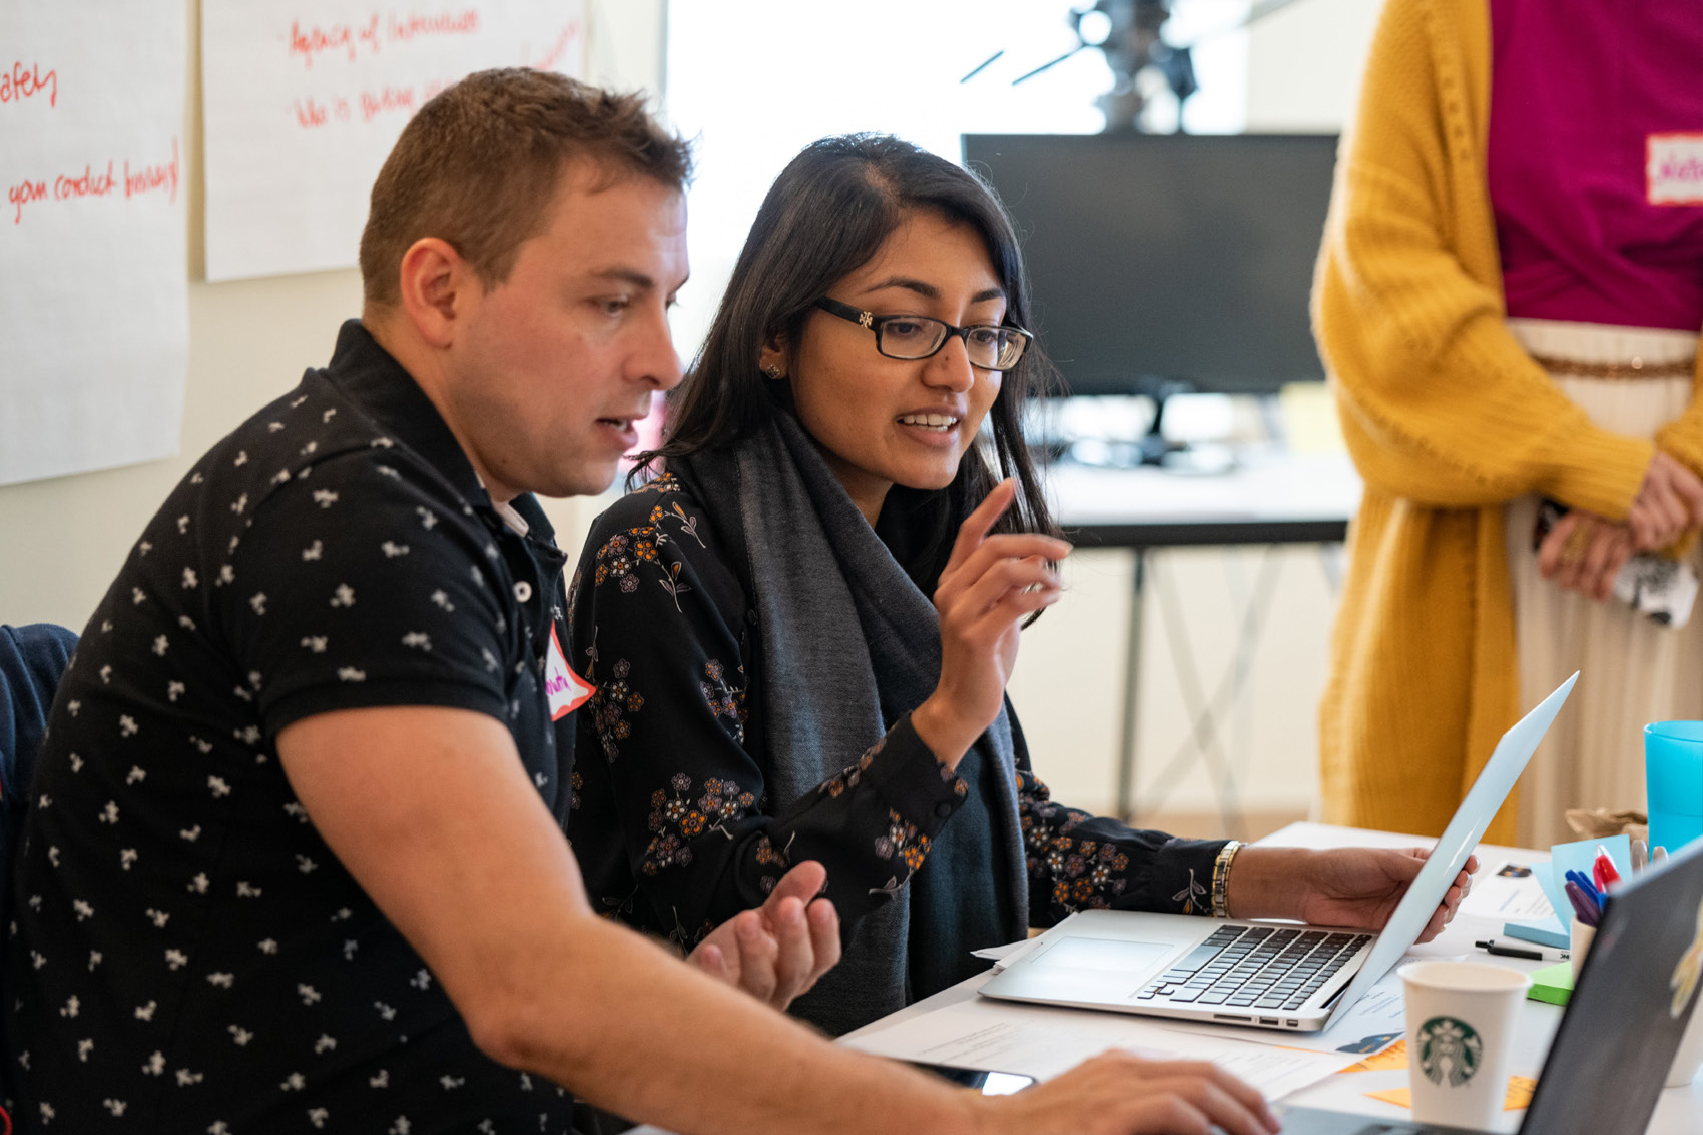
Designing the coalition and community that will drive adoption of a new open standard for education data, so a learner's records can follow them across institutions and into the workforce.
Digital advisory across business development, knowledge management, and innovation, helping teams from headquarters to country offices adopt new tools and new ways of working.
A train-the-trainer network of trusted advisors delivering AI training and events for nonprofits, state and local government, and community organizations across the U.S., keeping a human layer around the tools.
TechChange is the home for a set of products and gatherings built for the social impact world.
The world's largest gathering for digital health, held every December — this year in Bangkok.
gdhf.digitalThe flagship conference for technology in global development, run with Catholic Relief Services.
ict4dconference.orgDH:PNS, a WHO-recognized global good used by planners in 93 countries.
digitalhealthtraining.orgThe platform for digital gatherings that actually feel human: spatial audio, AI co-facilitation, and 200+ interactive templates.
getkolab.aiThe job board and talent network for social impact hiring, connecting mission-driven employers with 40,000+ professionals a month.
impactsource.aiExecutive and team coaching for social impact leaders, delivered at scale.
impactcoach.com2,200+ registrants from 115 countries. 97 Ministry of Health representatives, 550+ presenters, and private sector leaders from Johnson & Johnson, Google, and Microsoft joined funders like the Gates Foundation and the World Bank. GDHF returns every December — next stop, Bangkok.
See the 2025 end-of-year reportThink FHIR, but for education. We're building the adoption ecosystem for a new open standard so credits and credentials travel with students, designing the coalition and community that moves institutions, developers, and vendors from awareness to adoption.
A national initiative to expand digital opportunity across the US. We power the platform and run the local convenings bringing business, education, nonprofit, and civic leaders together on workforce readiness and AI-driven skills, feeding TCS's Digital Opportunity Playbook and Council.
Read the case studyChanging how governments plan national digital health. For eight years we've helped 1,000+ government planners across 93 countries change how their countries make decisions about digital health... by building the people who lead it, not the technology. Launched with USAID's Bureau for Global Health, now carried by the Gates Foundation and the World Bank.
Explore the programJoin us and our partner organizations for hands-on learning across AI and digital health, open for individual enrollment.
Hands-on practice and expert guidance implementing today's AI solutions, with partners from foundations, nonprofits, and the private sector.
A blended course giving community health workers a foundational understanding of AI and its role in public health and service delivery.
A self-guided course building core digital skills across six modules, from devices and data management to communication, safety, and troubleshooting.
Working notes on AI in global health, what makes a convening stick, and where mission-driven funding is headed next.
Browse the archiveCheck the boxes that fit, add a little detail, and we'll come back with the right people and a way forward. No wrong answers.
Prefer email? info@techchange.org
Your message is on its way to the TechChange team. We'll follow up soon.