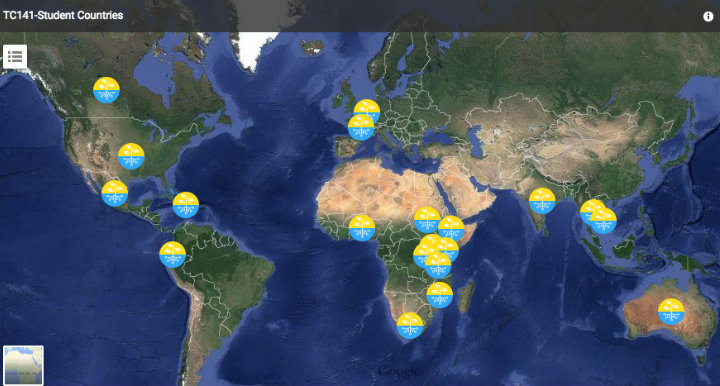
In June 2014, we wrapped up the second round of our Mapping for International Development online course. Nearly 60 participants joined us from Rwanda, Ethiopia, Benin, Mozambique, Australia, Kenya, Haiti, Thailand, France and 10 more countries. They represented organizations like Oxfam, Korea NGO Council for Overseas Development, Chemonics, Danish Demining Group, Abt Associates, and many more.
Before we start our next Mapping for International Development online course on Monday, we took a look back at the previous round of the course. Here are a few things we learned together:
1. Learning to create a map is much more than learning about mapping tools
In this mapping course, the participants were introduced to mapping tools beyond just Google Maps Engine, like Tomnod, Crowdmap, OpenStreetMap, and many more. But before diving into the tools, we kicked off our mapping course with a lively discussion on an ongoing debate about the power of amateur cartographers in telling their story by mapping their own communities.
In a course with various levels of mapping experience, this discussion was definitely a highlight of the course. Tom Mueller, a GIS professor at California University of Pennsylvania, pointed out in the course that “all maps are telling a story.” And the discussions in this first week made clear the participants’ view that the communities being mapped should have the power to tell their own story, whether it means creating their own maps or choosing not to be on a map.
Some of the participants were being introduced to thinking about the ethics of mapping for the first time through this mapping course. Participants grappled with questions like who is or is not represented on a map, is a map biased, what story is a map telling, who made the map and why.
“Mapping for International Development was much more than a class on how to use different mapping tools (for that, there are already many tutorials available online) but rather an excellent overview of the current debates regarding mapping for international development and current ongoing experiences.” – Fabien Maitre-Muhl, who works in the Community Violence Reduction section of UN Stabilization Mission in Haiti
2. The best maps require collaboration
Like the global digital mapping community, the participants and guest experts learned from each other in this mapping course. Nine guest experts joined us from OpenStreetMap, Tomnod, Ushahidi, GIS Corps and other organizations that crowdsource the talent of mapping volunteers to create better maps. The active engagement of almost 60 participants amongst each other and the guest experts made the four weeks of the course a great learning experience for everyone.
After the first week, we discussed the different tools used to create maps, and participants had a chance to share the maps they were working on. They were able to see each other’s work and find ways to collaborate and learn from each other’s experience. Tom Mueller’s final project for the course was creating a mapping project for his students where they used social media to map ongoing crises around the world. He created the project by getting feedback and suggestions from the other participants in the Mapping for International Development course.
“Thanks to all the other course participants. There were some really interesting posts in the forums and obviously some fascinating and important development and humanitarian work is going on around the globe. The course certainly raised my awareness about the role that mapping can play in this work, as well as the kinds of barriers and challenges that mappers have to negotiate in a range of social situations.” – Gary Scott at Australia Central Land Council
“I have effectively learned how to create an interactive map using tools such as QGIS and TileMill starting from nothing thanks to this course.” – Mattia Zanazzi at the UN Stabilization Mission in Haiti
3. Mapping makes the invisible visible
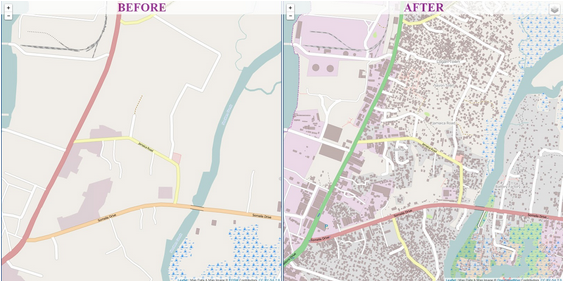
Fabien Maitre-Muhl, one of the course participants noted that, “mapping helps make the invisible visible.” Increasingly, digital mapping is becoming important in expediting humanitarian response as it is crucial to reach the population most affected by crisis in the most remote areas. During the Ebola crisis, OpenStreetMap helped map the affected areas to make tracing the outbreak easier.

Map of Monrovia in OpenStreetMap before and after volunteers mapped the city in response to the Ebola crisis. (Humanitarian OpenStreetMap)
Mapping can also help visualize the impact of international development projects. Mira Gupta, a TechChange alumna from the previous Mapping course “used election maps to illustrate to [her] research team that once geocoded there might in fact be very distinct geographical trends in the data” for a maternal and neonatal health qualitative study.
The last Mapping for International Development online course introduced the participants to various mapping tools, and more importantly, facilitated engaging conversations among people with varied levels of expertise from all over the world, and helped them get a better sense of the mapping needs and impacts for projects they were working on.
More than two dozen participants from 13 different countries have already enrolled in our upcoming Mapping for International Development online course, representing organizations such as Oxfam, Deloitte, Helen Keller International, United Nations, International IDEA, Vera Solutions, PwC, and more!
You can join us too! Sign up today for our Mapping for International Development online course, that begins Monday, March 2.


