Reflections from TechChange’s Gender Data 101 Edition 2.0 Online Course

|

Guest Blog Post By: Amanda Livingstone (she/her/hers)

Facilitator, Communicator, and Campaign Strategist for Reproductive Justice

Amanda.j.livingstone@gmail.com | www.amandalivingstone.com

What TechChange’s Gender Data Online Course is all about and why I signed up

TechChange’s Gender Data 101 Edition 2.0 is a 5-week blended online course organized and facilitated by the incredible Natalya Buchwald that featured live events with gender and data experts, online tools and tasks, and provided additional resources that could be used within our professional environments. The course gave participants the skills to:

  • Define best practices needed for gender data at all stages of the data life cycle (collection, processing, analysis, visualization, uptake, and impact)
  • Identify the multiple forms of systemic discrimination that affect the overall efficacy of gender data
  • Evaluate the limitations of the gender binary and how it may affect the phases of the gender data lifecycle
  • Create action-oriented strategies and an intersectional approach to combat gender data inequities and biases

I was keen to sign up to 1. Improve my skills at effectively implementing the data life cycle throughout a project I managed that focused on women’s and girls’ sexual health and rights and 2. Continue to dismantle and unlearn my own internal biases on gender and race and reconstruct more affirming and intersectional approaches for improved organizational strategies and impact.

Why everyone should take this course

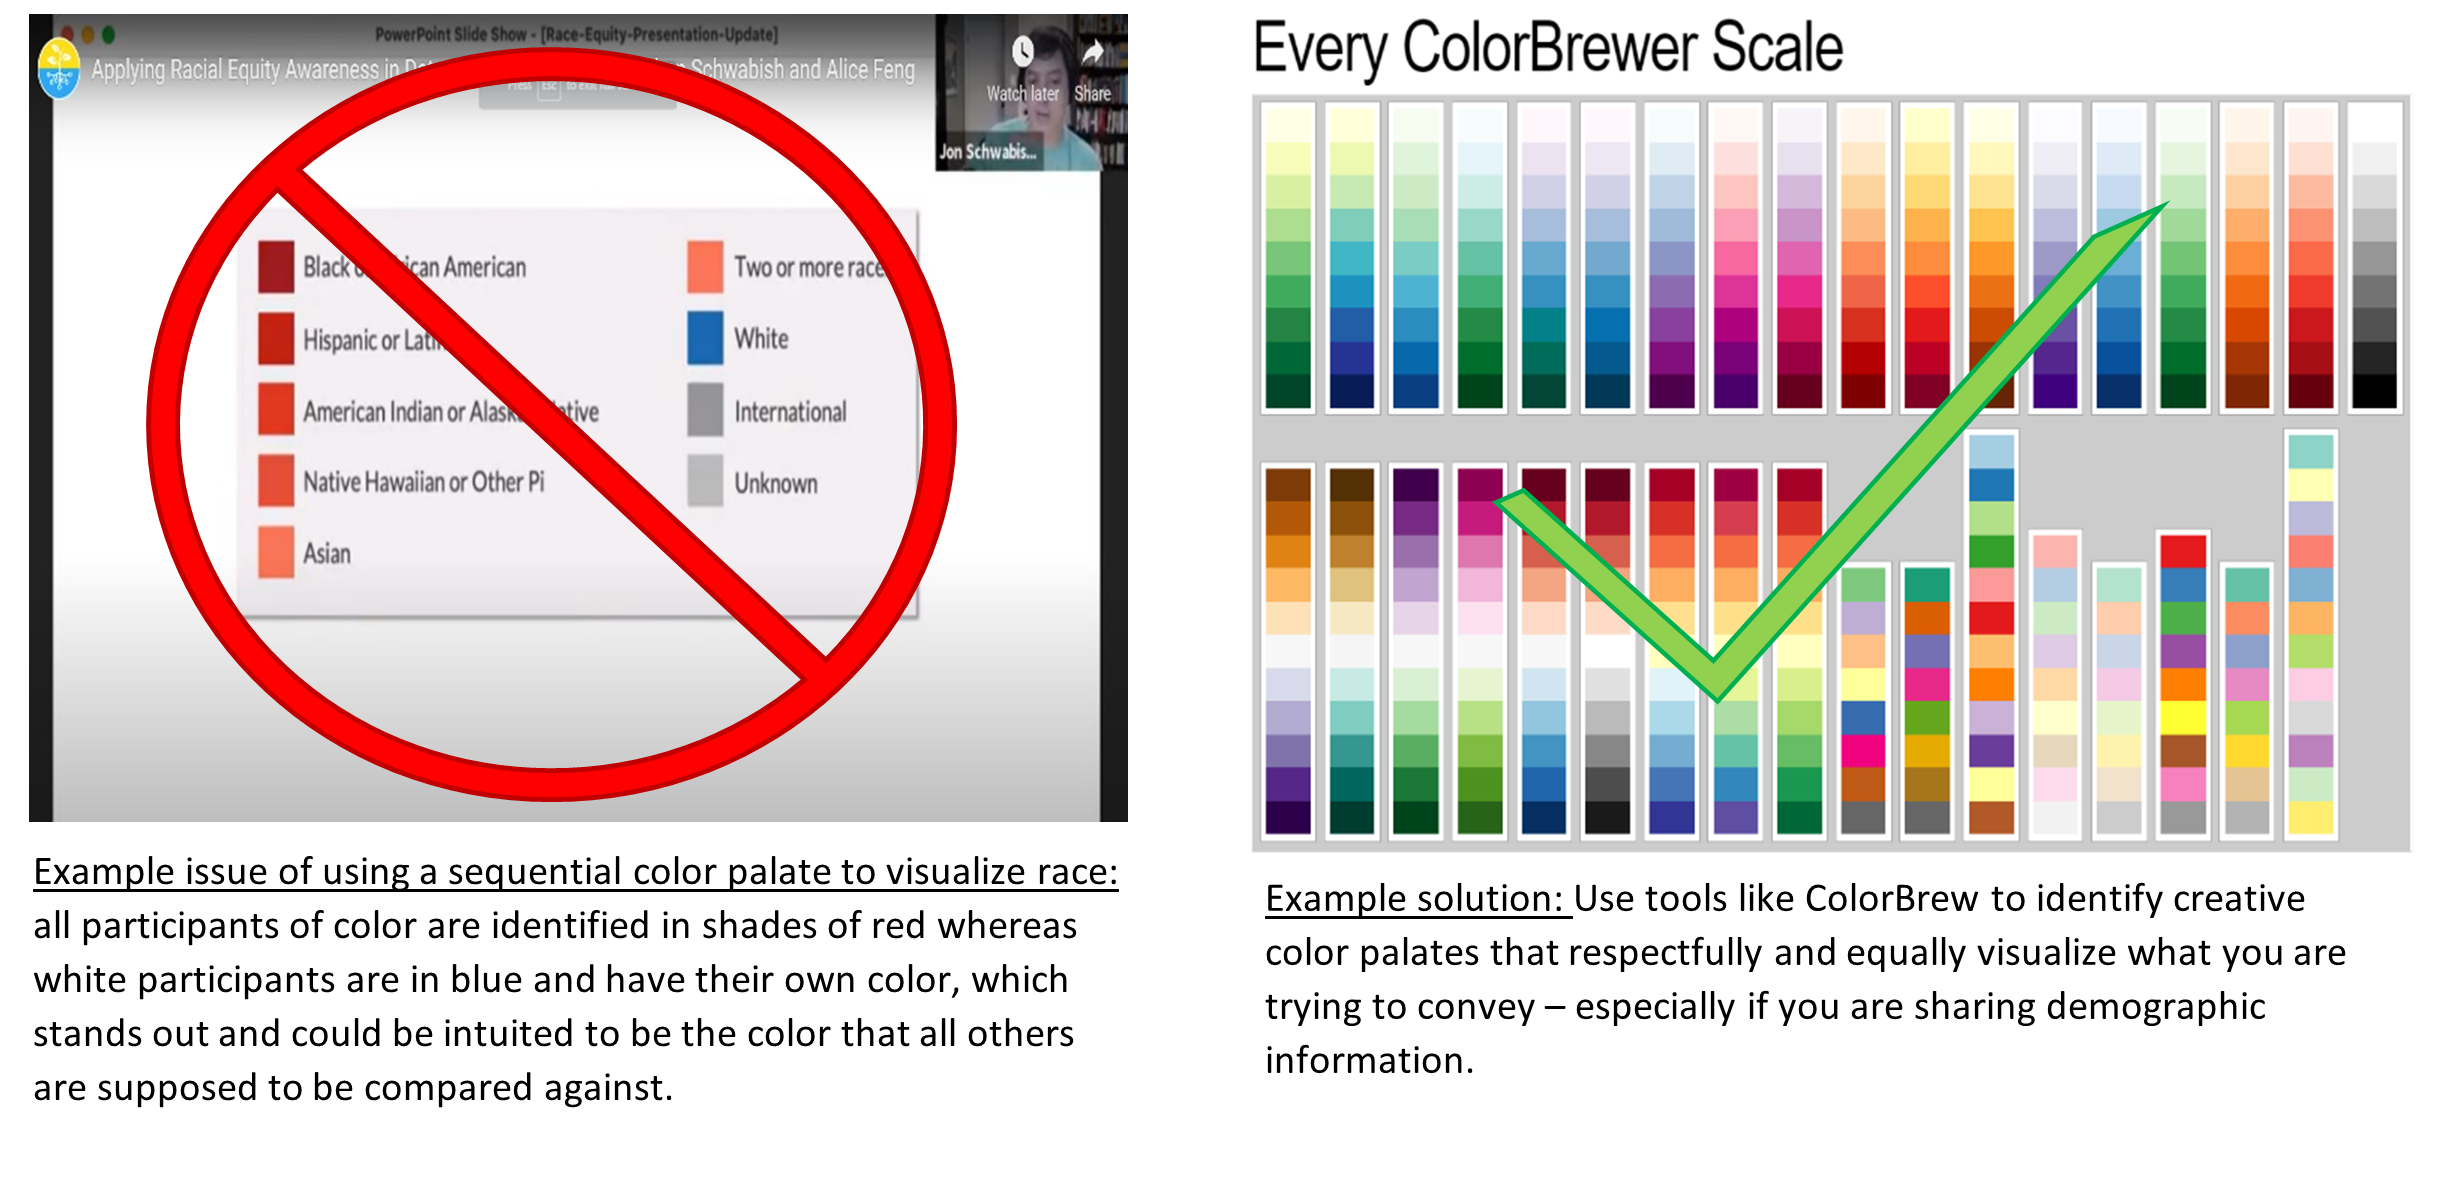
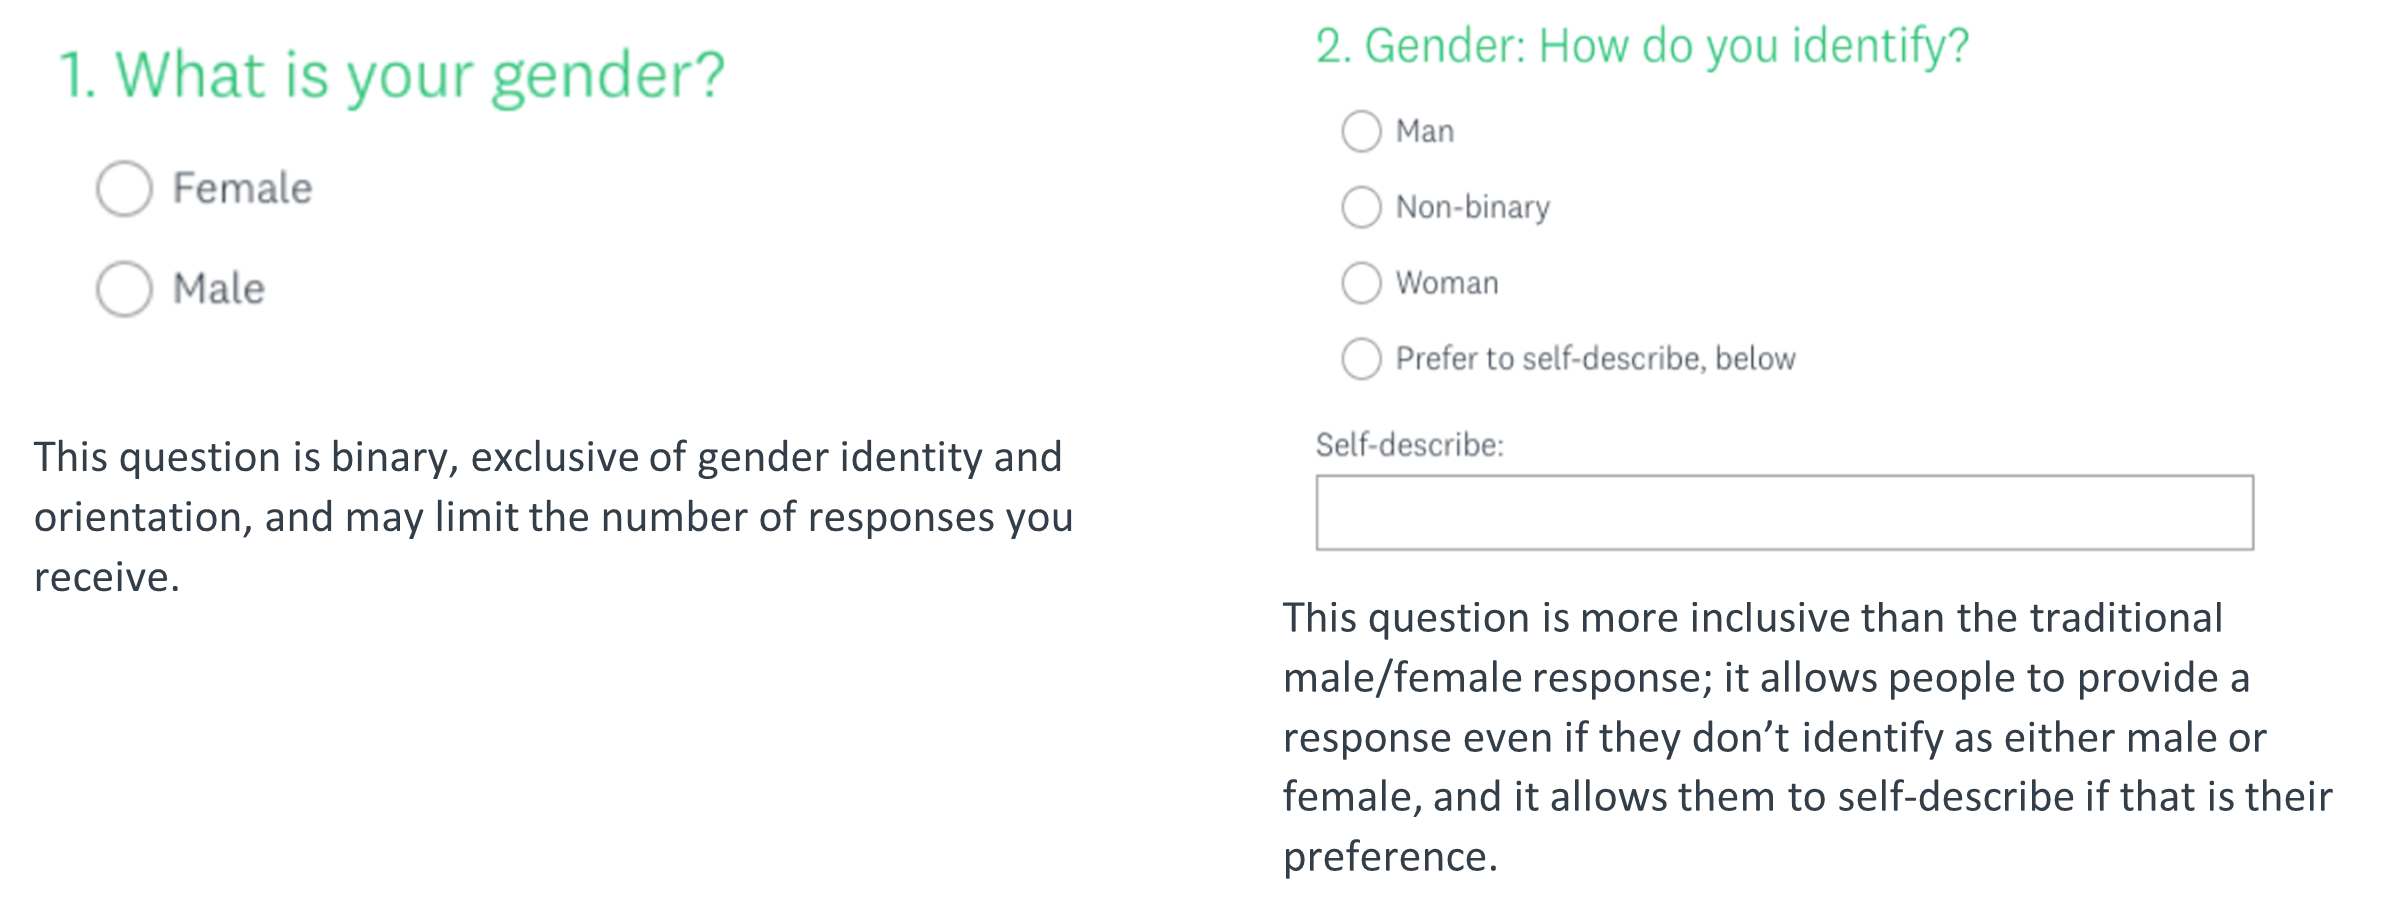
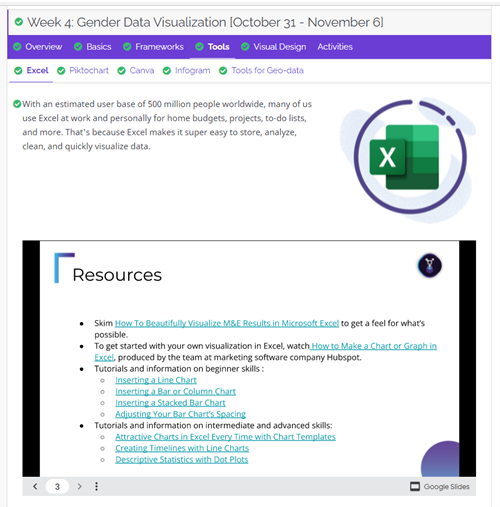
The course covers five key topics: fundamentals of gender and data; gender data collection and processing; gender data analysis; gender data visualization; and gender uptake and impact. At first, I was pretty hesitant to dive in – full well knowing my inability to use advanced excel formulas, GIS, and most of the acronym-ed data analysis tools out there – but the course progressed at an accessible pace, offered several engaging guest panels, and included how-to videos for those of us who may have needed a second watch to let a new methodology or tool fully sink in (cough me cough). The course also delved into how systemic discrimination based on gender, race, ability, geography, and more negatively affect the overall efficacy of gender data and how we can work to identify and combat discriminatory practices from the start. The course ends by asking all participants to take actionable steps to employ gender data to create and improve impactful programs within their professional and everyday lives.

My top 3 takeaways

  1. Once you start identifying discriminatory data collection methods and visualizations, you can’t – and shouldn’t – unsee them. From filling out a survey that doesn’t include your race but rather lists “other,” to only offering “male” and “female” gender identity choices, to the color choices used in mapping visualizations – discrimination and biases in data collection, analysis, and visualizations are far too prevalent. I also recognize my privilege and embarrassment that it took a class for me to be fully aware of these systemic types of oppression and how they are directly connected to the harmful ways that information is understood and shared, how choices (like policies and laws) are made, and how resources are allocated. This also extends into and is a foundation of the decolonization of research in the development field more broadly. My ask to readers: When you see a collection method or visualization that – purposefully or not – is exclusive, discriminating, or biased – write to/call/tag the author/organization/etc. calling out the issue and encouraging them to make the necessary changes to make their methods more inclusive, affirming, and respectful.
  1. Everyone can make inclusive adjustments to their gender data collection and visualization methods. Many of the tips shared in TechChange’s class were straightforward, doable, and can be integrated into pretty much any data collection, analysis, or visualization method. Are you about to ask your staff or your organizational members to complete a survey? Make sure to double-check if it could put someone’s privacy or personal information at risk. Ask yourself if it only allows individuals to check “male” or “female” rather than letting folks self-identify. When you’re making a graph visualizing your survey’s results – what colors are you using to represent participants’ responses? Who is asking the questions, and who will see the answers? And how are you portraying the data within your larger contexts? These are just a few questions to ask yourself before, during, and after requesting information from a broad and diverse audience.
  1. TOOLS. I love a good tool – whether it’s a template for a new, integrated workplan or a chart that helps me better decide what type of data visualization tool I should use, I want to see them all. This course offers, dare I say, hundreds of free, easily accessible online tools that can support users in all their gender data needs. I have downloaded many of them and use them daily. Below is a sneak peek of some available tools shared.

All in all, I highly recommend this course to anyone looking for support on a specific project or to folks who are interested in broadening their inclusive data collection, analysis, and visualization skills.

For more information on the next available course, email: info@techchange.org

Also on TechChange Main

TechChange President Nick Martin Selected as runner-up for Society for International Development’s Rice Award

We’re excited to announce that TechChange president Nick Martin was selected as the runner-up for the 2014 Andrew E. Rice Award...

Looking Forward to GDHF 2024

By Rose Nyzoka, Co-Chair of the Global Digital Health Network and Country Representative at Palladium  The Global Digital Health Forum...

Global Internet Access Initiatives: Breaking Down Digital Divides for the Developing World

Internet connectivity is increasingly being seen as a human right in our digital world. Today, most of us can’t imagine...