Feature Announcement: Reporting Dashboard Launched!
|

Whether we’re working on big features or small ones, it’s always our goal to continually improve user experience on the TechChange online learning platform, and it’s especially exciting to work on implementing the visions and ideas of the users themselves! Our most recent project, driven by many requests from our partners, is the Reporting Dashboard. And it’s finally ready for launch! Over the next several months, we are planning on rolling out a number of upcoming features through this dashboard. As always, we’d love to hear from you along the way!
The purpose of our original Admin Dashboard (what you see when you first login to the admin portal) is to provide a live snapshot of interactions across the platform. It’s a pre-curated set of graphs and metrics that we’ve designed and tested to be the most helpful for general purpose analysis.
The Reporting Dashboard is quite different. Yes, there are a few similar graphs and some elements may feel similar, but the underlying motivations are different. The Reporting Dashboard is a tool with which to tinker, make comparisons, and highlight personalized trends.
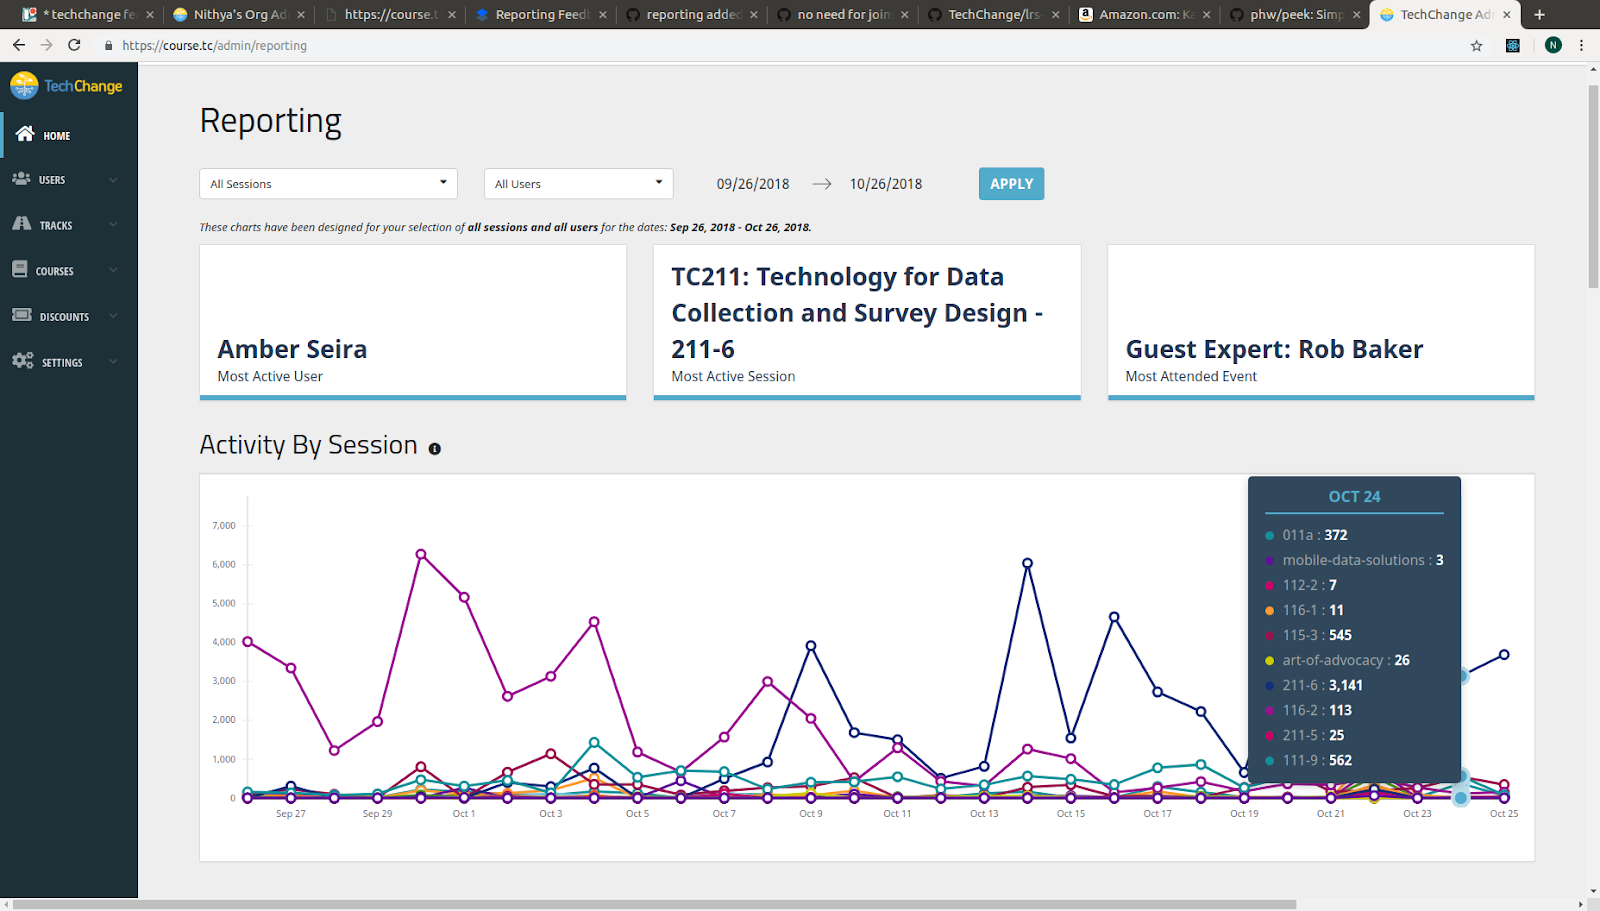
As a platform partner, from the moment you land on the page, you get to determine what you’d like to see. What sessions are you looking to investigate? Maybe you want to see a user’s engagement across all their courses? How do your users most commonly engage with the platform? What trends arise as you look at the various leaderboards and progress charts? The questions are endless, and this is just the beginning!
As you think of questions you could ask about your platform, use the dropdown filters to select specific sessions and users. Then click “apply” and you’ll see all kinds of charts and metrics appear. If you have questions about what the chart shows, each chart has an info icon in the title, which can help users understand what data is being displayed.
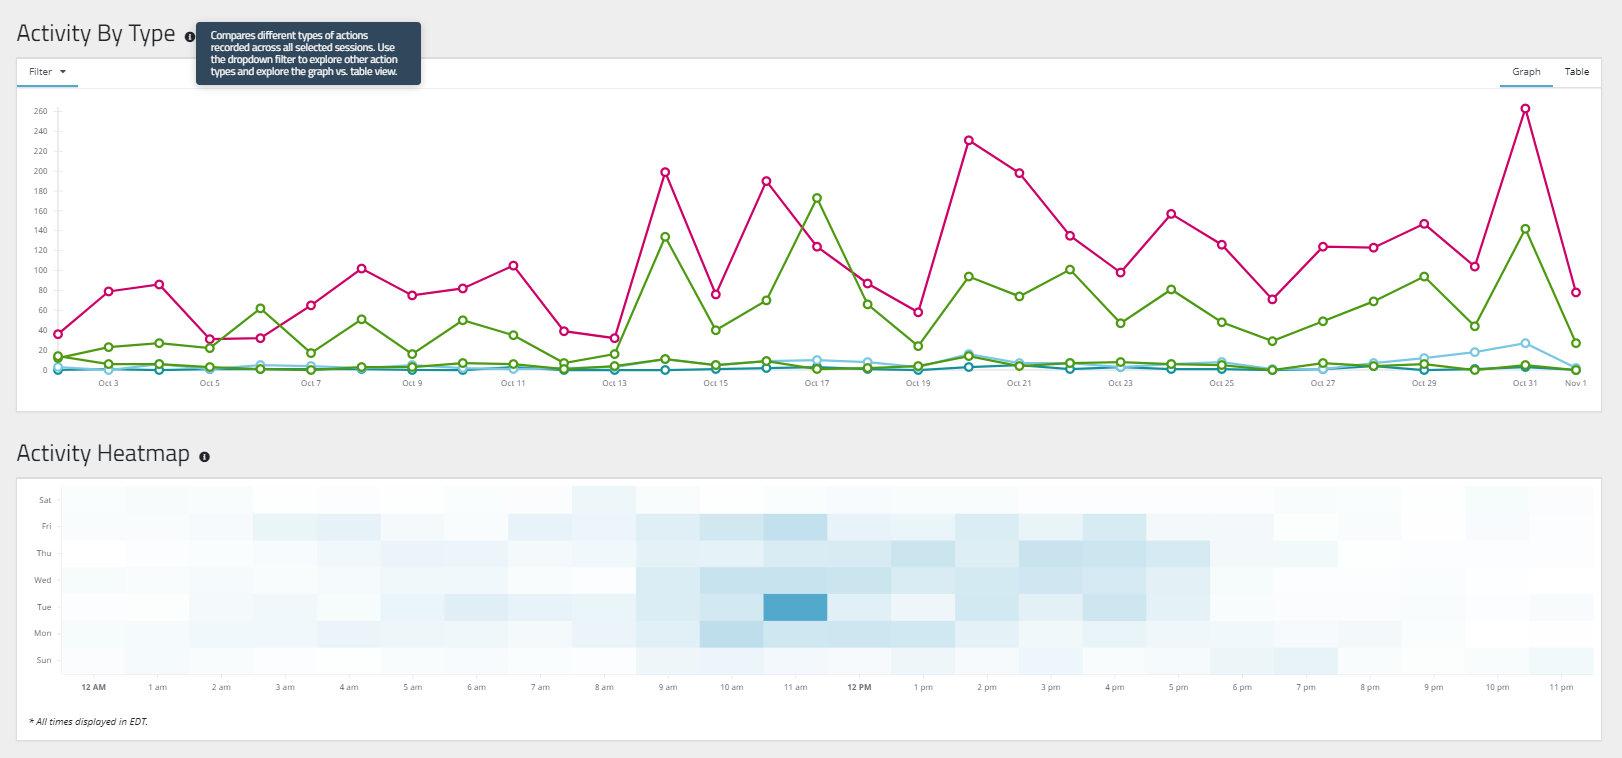
Explore the visualizations and see what conclusions you come to. And most importantly, we hope you leverage these findings when you continue designing and targeting your content in the future!
Beyond using the Reporting Dashboard to understand your own platform, you now have the ability to use these charts as a way to tell the story of your impact to other people. Maybe you want to generate the data for a specific session and use it to help those facilitators make improvements. Or maybe you want to showcase overall engagement to your stakeholders. In order to help you leverage this functionality, our next steps will be to implement features around customizing the charts, saving past reports, and exporting to pdf, but before these are ready, we hope you still find ways to share and act upon the results of any exciting reports you generate.
The Reporting Dashboard is the start to all kinds of monitoring and evaluation possibilities. As we built this tool, we often got carried away thinking about all kinds of data and functionality that would help create even more impactful metrics in the future. We’re learning as we build, and there’s a lot more that we plan to do in the future.
As you start exploring, we hope you won’t be shy in sharing your thoughts with us. After months of working to get the core functionality squared away, a small round of user testing played a crucial role in adjusting the Reporting Dashboard for greater usability. Now that it’s released to all of you, we can’t wait to hear about your experience, your stories of exciting discoveries, and all your ideas for the future.
Want to gain even more control over your insights? Simply download the LRS data for your entire organization on the admin dashboard, or for each session on the session enrollments page. Then import the data into your favorite business intelligence tool.
The end of September 2011 witnessed scattered renewed protests in Sudan against the hike in prices of food and other...

By: Sacha Robehmed, FDDF Ambassador (Jordan), and Partner, Digital at Expectation State With the new year often comes transformation. A...
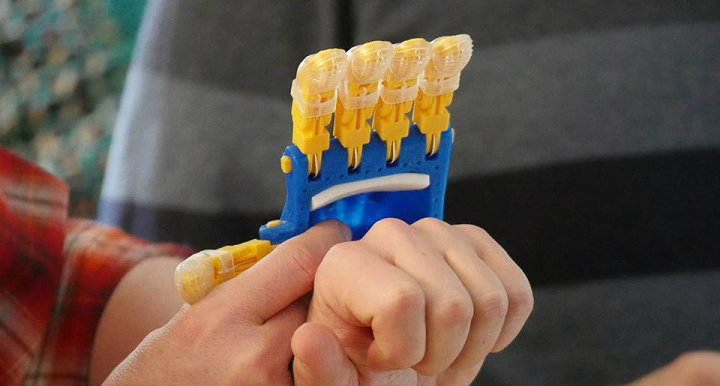
With the emergence of the 3D printing industry, how can 3D printing help kids who need upper limbs and fingers?...