TechChange Offers New In-Person Data Visualization Workshops
|
Is your organization trying to figure out how best visualize program or organizational data? Perhaps struggling to find the best tools to tell your stories better?
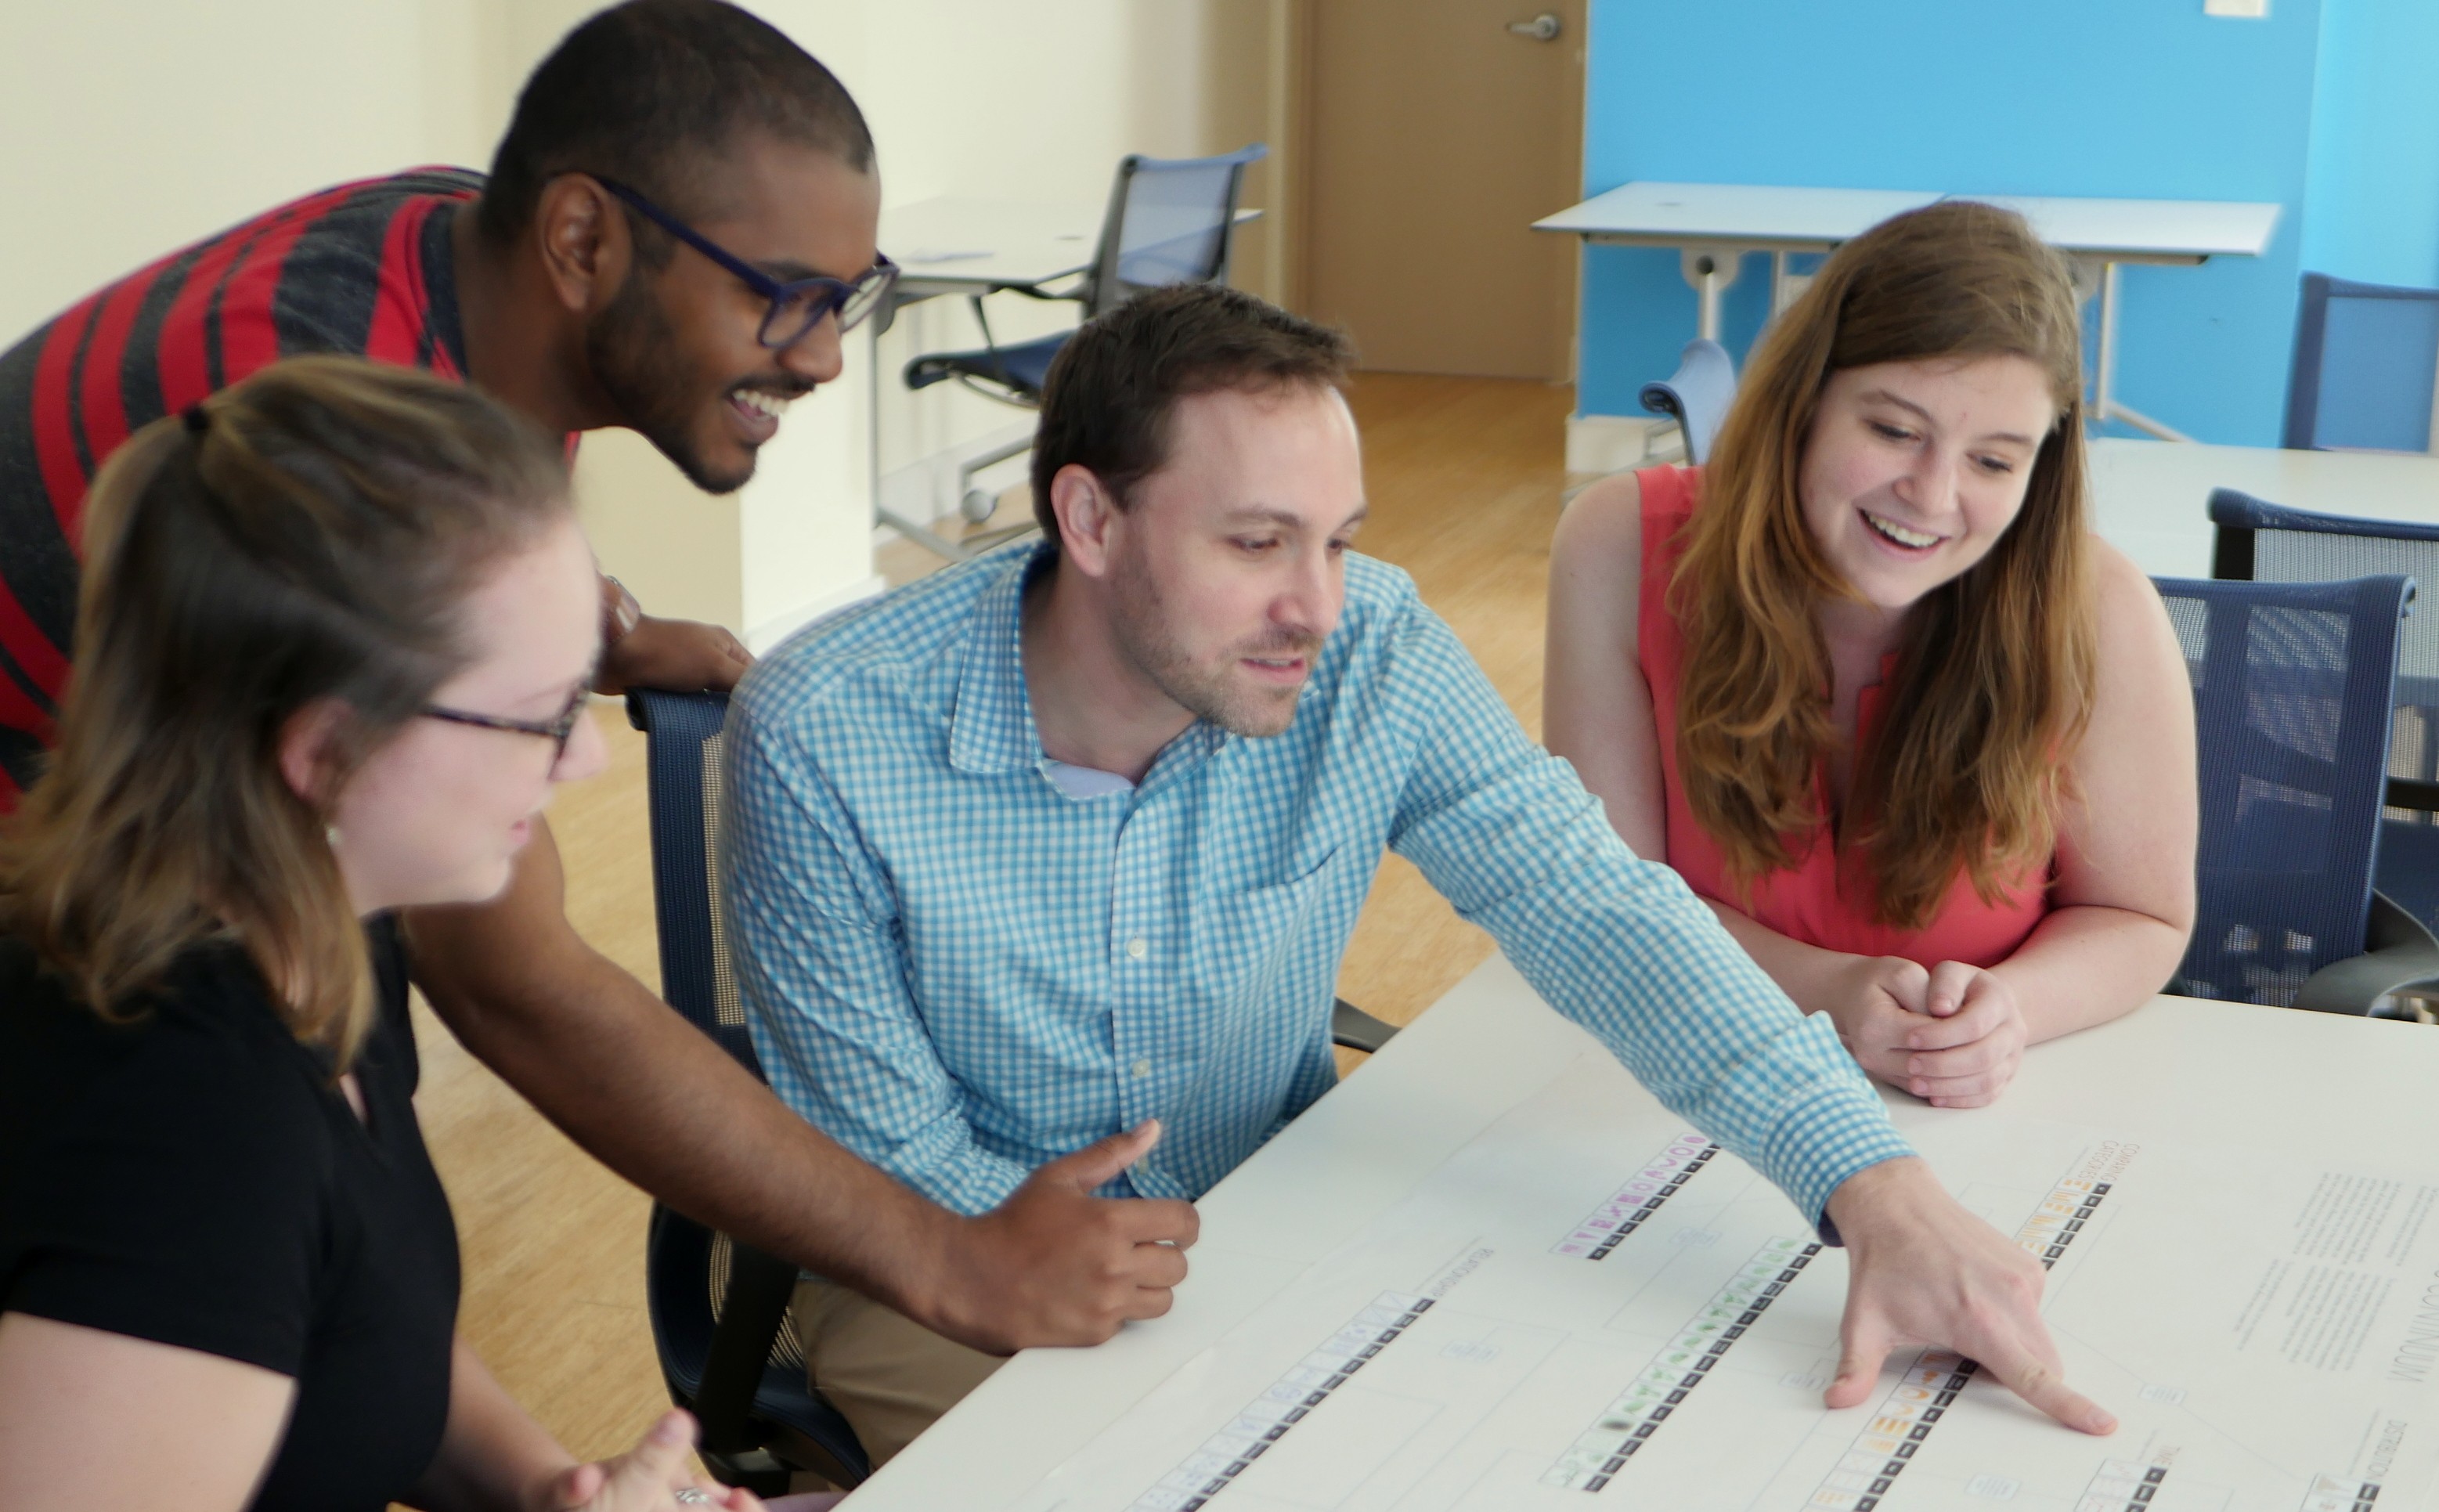
After two years of offering our most popular course Technology for Data Visualization, TechChange has decided to go off-line and create an in-person workshop on the topic. For those of you who are in the DC area, this in-person workshop offers a social, hands-on way to better understand data visualization.
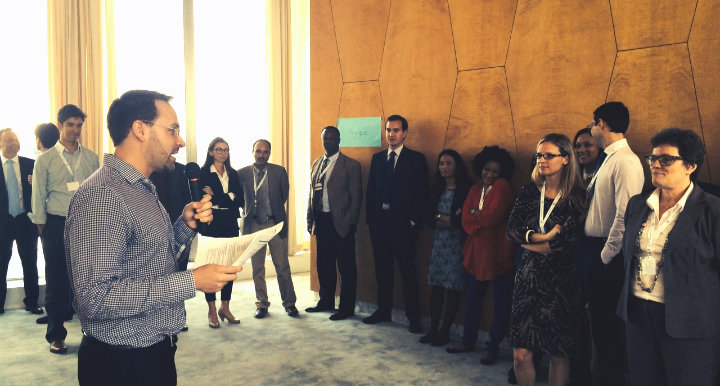
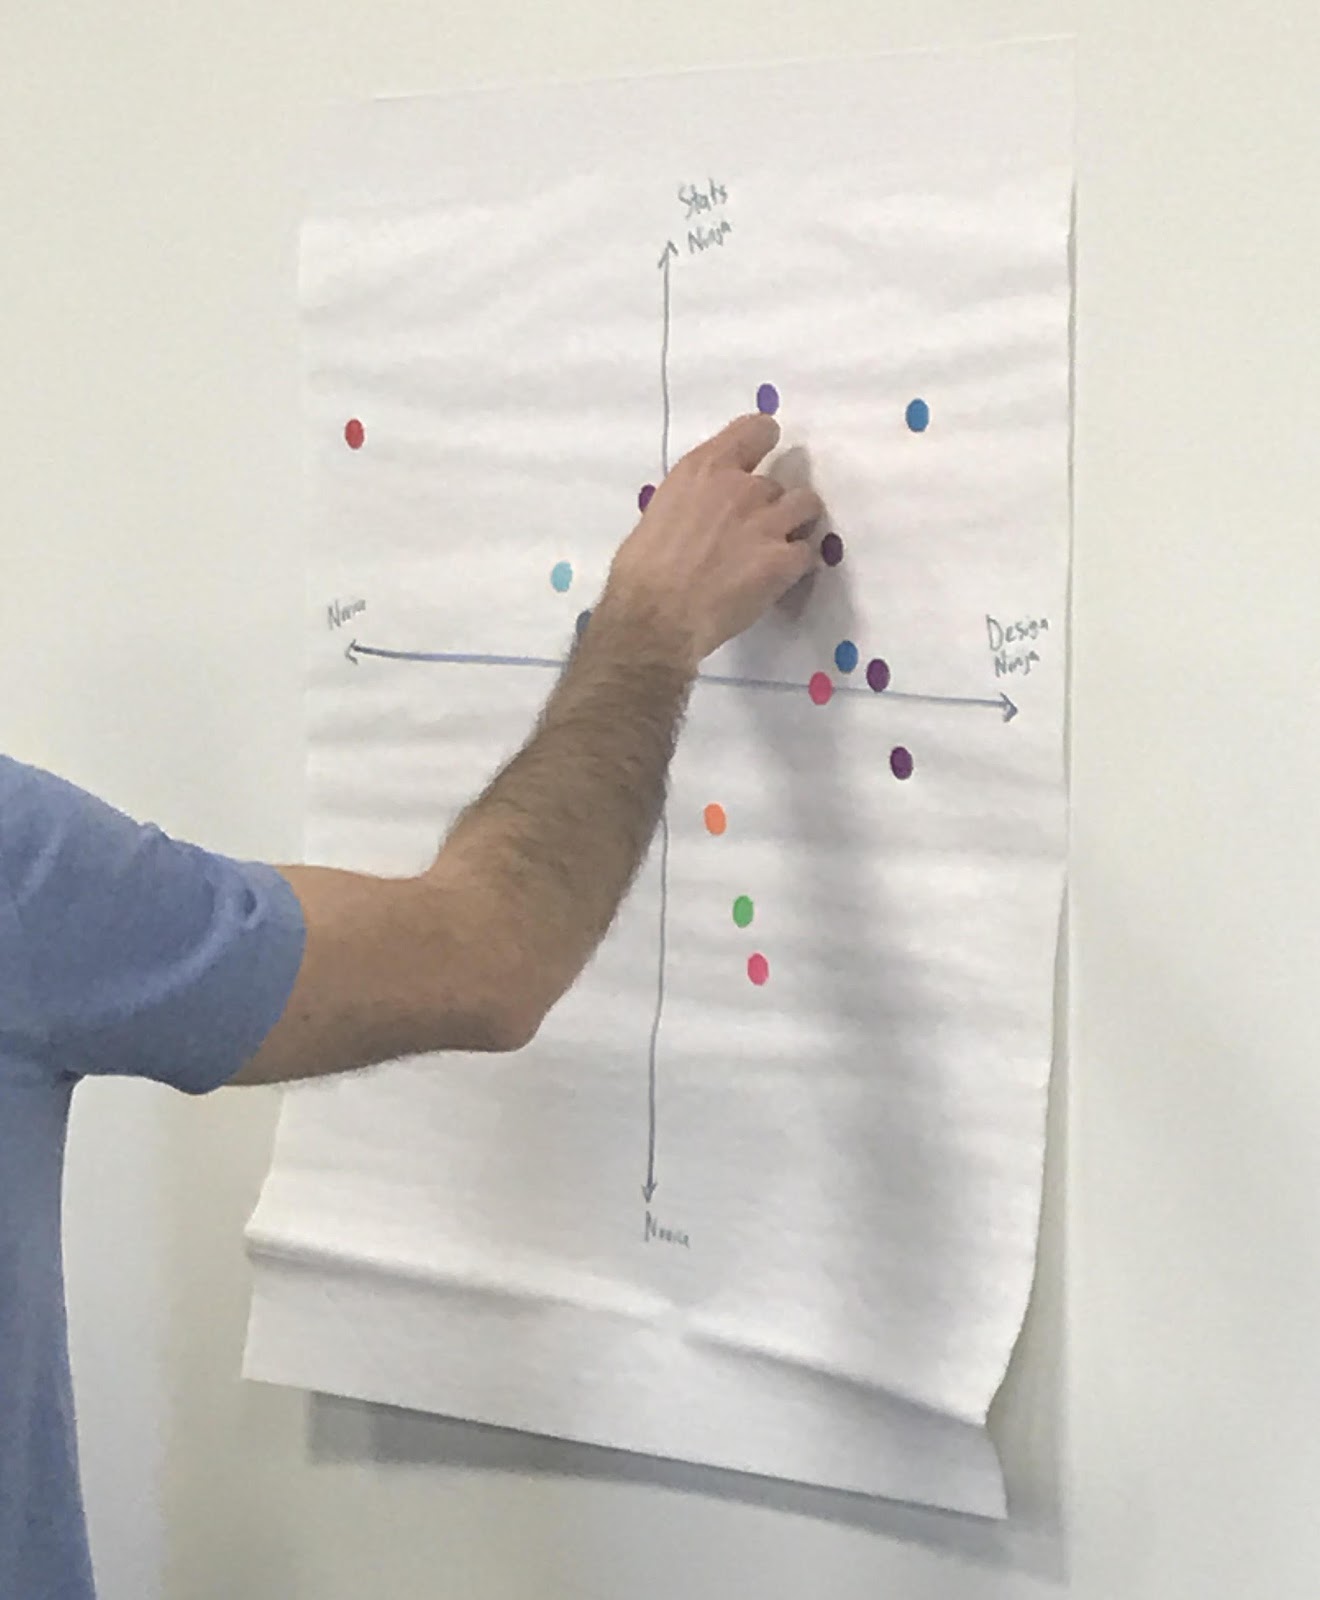
Participants participate in a human likert scale exercise called “Agree-Disagree.”
The workshop is composed of three fundamental building blocks:
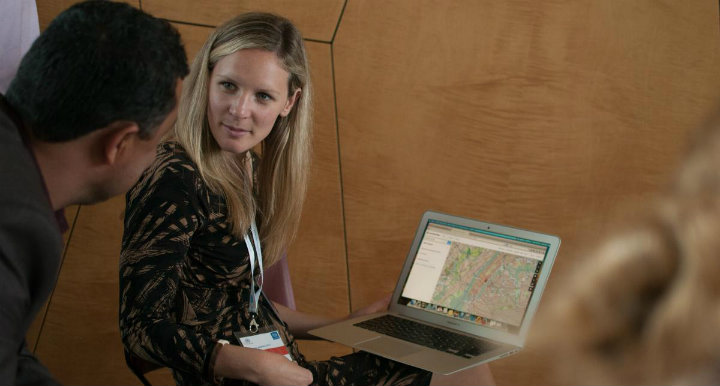
Workshops can be tailored to feature a variety of mapping tools and software.
The workshops can be tailored with custom content and designed for a half-day up to a full week.
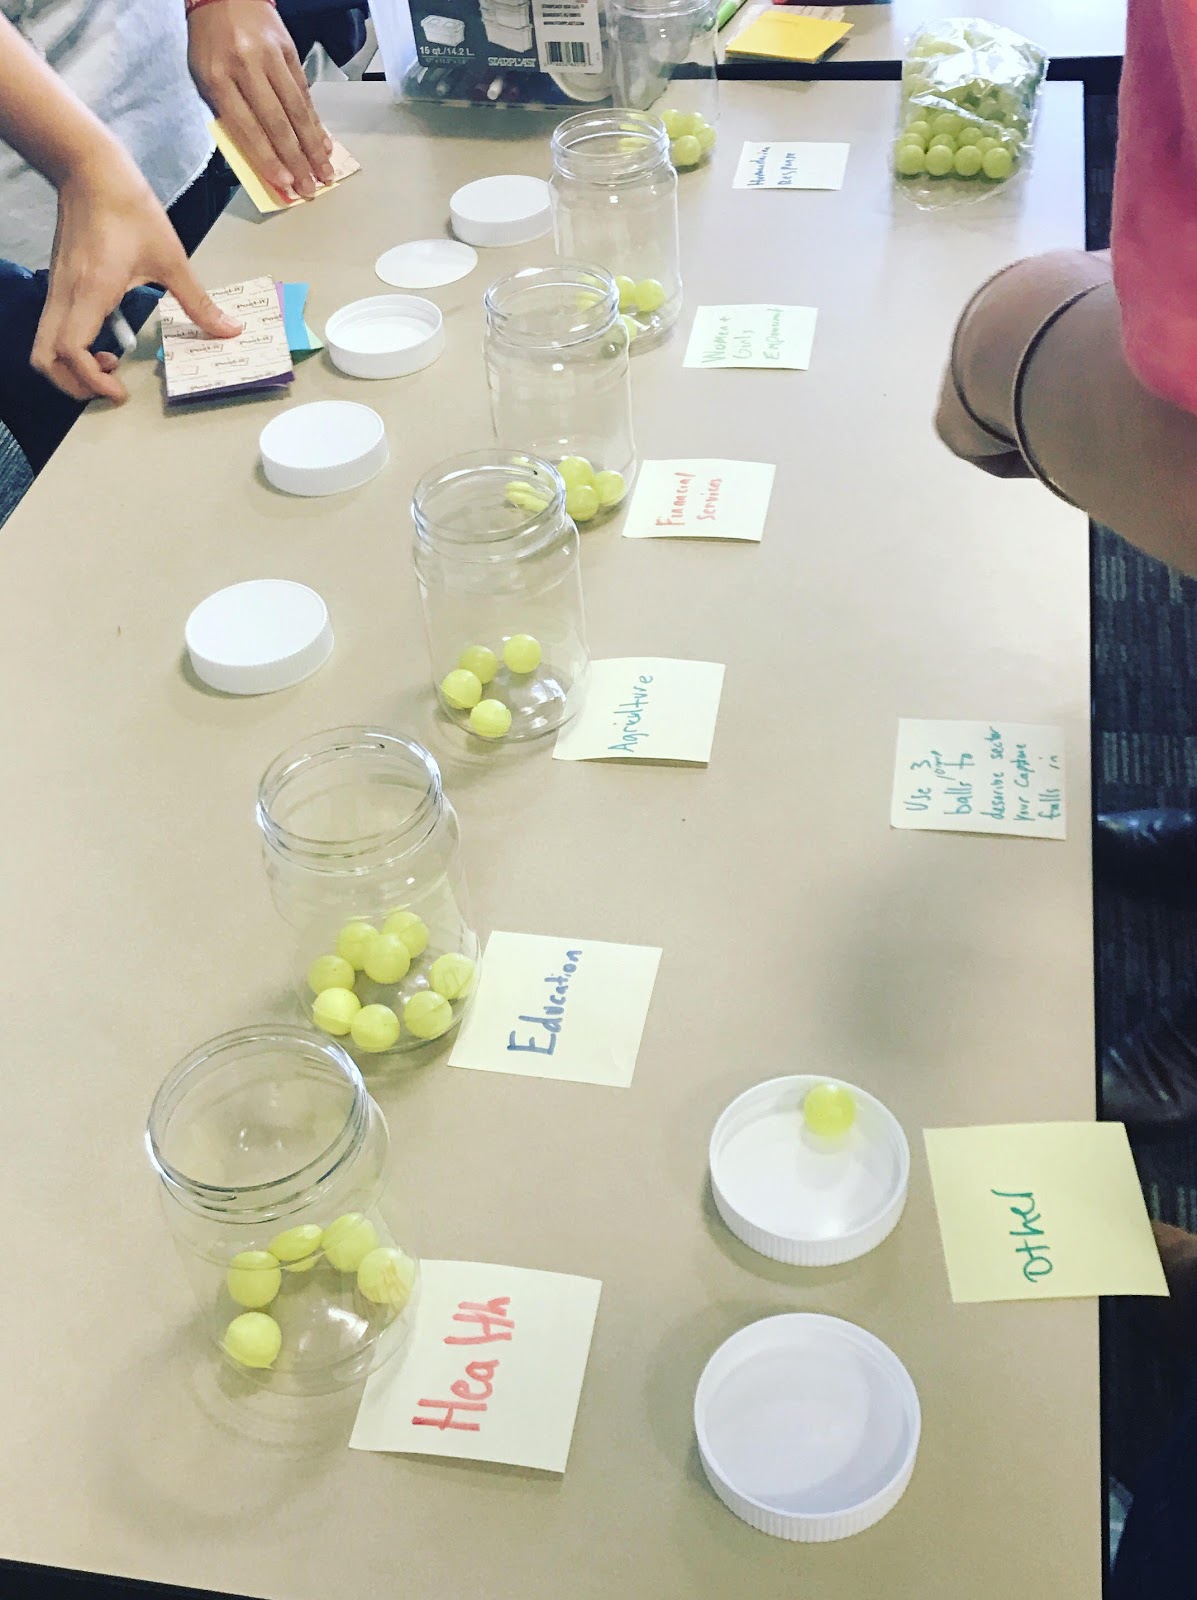
As part of the workshops we’ve included a number of hands-on interactive activities using human likert scales, balloons, ping-pong balls, stickers galore, emojis, neon hats and more. Plus, if you’re someone who likes to have someone to coach you through navigating a new software, we can provide you with that guidance in real time.
So far this year we’ve been busy facilitating workshops for Georgetown University, Jhpiego, Arabella Advisors, and more. Case studies and exercises have focused explicitly on examples like public health, water & sanitation, climate change, financial services for the poor, human disaster response but can be tailored to any sector or industry.
Sign up for one of our monthly in-person workshops at our new training space on 13th and U. St NW Washington DC, or write to us about doing a custom training at your organization on Tech for Data Visualization today. Workshops are offered on the following dates:
Much of the event data that new technology is making available to practitioners contains geographic information, and to take advantage...
Best practices conferences are critical to the growth of any community. The sharing of ideas and capturing of collective lessons-learned...
A Beginner’s Introduction to Institutional Innovation Written by Joe Agoada and Jennifer Estevez, Co-facilitators of TC108a: Intro to Intrapreneurship Intrapreneurship...