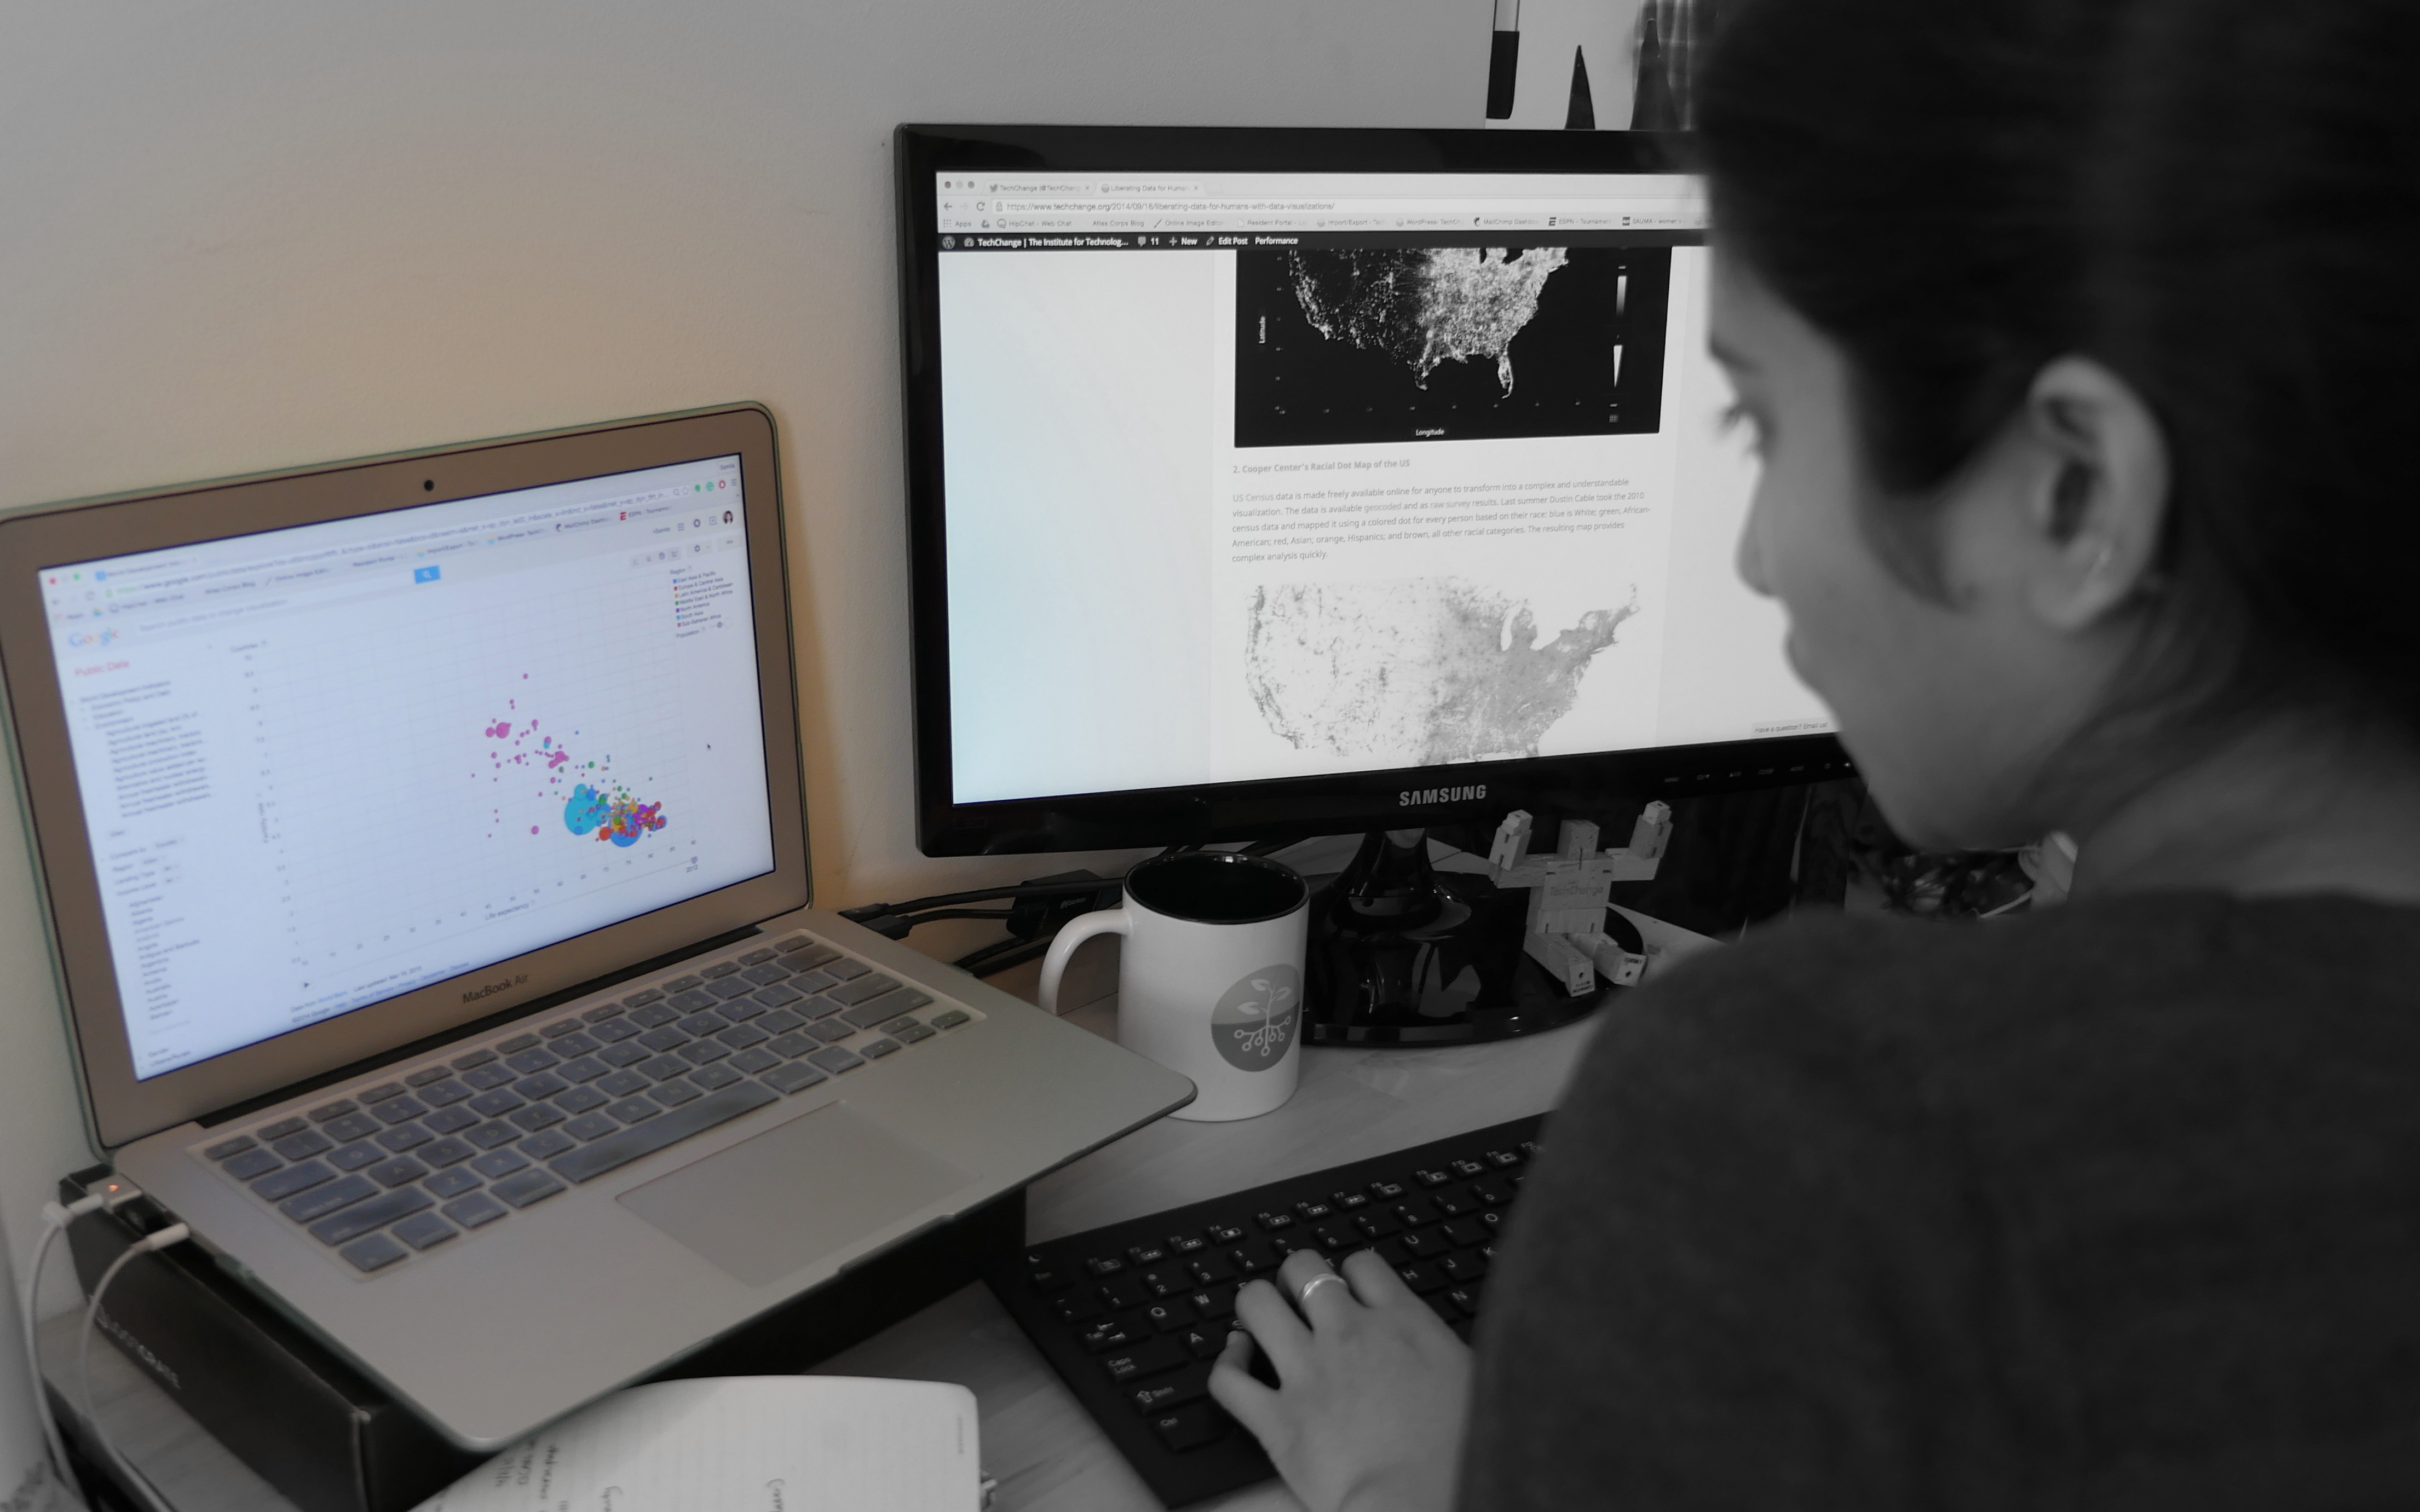
How do you make the invisible visible? How can we keep up with our ever-changing world, and how can we utilize the technologies of our time? Upon the completion of TechChange’s Mapping for Social Good course, we have found that some answers lie within the realm of digital mapping and geospatial data collection.
From Theory to Practice
The course features four weeks of case studies and real-world map applications, a diverse set of guest speakers, and innovative tech tools to invoke critical spatial analysis with social and environmental perspectives. Each new week introduced a set of social and environmental themes. Issues such as Water, Sanitation, and Hygiene required an advanced geographic understanding of land use and climate patterns to produce meaningful maps, and cutting edge tools such as CartoDB, Mapbox, and Leaflet empowered our understanding through spatial analysis.
In search of balance, participants discussed the necessary steps in designing an attractive, efficient, and safe urban infrastructure in Abu Dhabi, and discovered the complexity of the plan. Taking into account population, available surface area, and the availability of funds and resources, the course discussion forums were flooded with professional expertise and insight in how to build infrastructure that reflects the city’s urban lifestyle.
But Data Considerations Aren’t Only About Tech
A discussion on ethics can often be overlooked in this technical environment. But in Week 3, Nathaniel Raymond of The Signal Program on Human Security and Technology led a talk that highlighted recurring challenges associated with technology and humanitarian efforts. In doing so he introduced the concept of Demographically Identifiable Information (DII) – a close relative to that of Personally Identifiable Information (PII). His message put forth “Do No Harm” caution to humanitarians, encouraging critical thought and consideration for the most vulnerable populations in our world, remembering that we both hold, yet lack, so much power with technology.
Engaging Formal and Informal Institutions
Of note was the interaction between the global volunteer community of mappers and major donor institutions. A team of geographers and cartographers from the State Department’s Humanitarian Information Unit joined the class to discuss Mapgive and Imagery to the Crowd, a program that provides satellite data to global volunteers during times of crisis, and shows just how far the digital humanitarian community has come in the past decade.
Interactivity in Online Education
Throughout the course, participants presented their digital maps, addressing fundamental questions like, “what is the purpose of this map?” and, “will it give us exactly what we need, or simply what we think we need?” We’ve seen land-use maps of Washington, DC, conflict maps tracking violence against civilians in Libya using QGIS, and district density maps using the CartoDB application.
Upon completion of the TechChange course, “Mapping for Social Good,” we hope that participants feel well-equipped with some of the best mapping resources of our time, and that they have taken their professional experiences to new and challenging levels.
About the Authors
Madeline is a student at James Madison University, where she studies Political Science, Humanitarian Affairs and Geographic Information Systems, with a special interest in Conflict Resolution and International Landmine Prevention. In her free time, she loves to bike, paint, and eat chocolate pie while listening to Dave Brubeck.
Greg works on training and analytics with the Bureau of Conflict and Stabilization Operations at the US Department of State. He has spent his career working at the intersection of conflict resolution, technology, and the arts. Trained as a mediator, he also worked with the Northern Virginia Mediation Service and the US Institute of Peace. As a technologist, he has leveraged Geographic Information Systems for health interventions, humanitarian response, and conflict analysis purposes. He holds an MA in International Studies from the Josef Korbel School of International Studies at the University of Denver.


