Have you ever wondered how visualizations like the One Million Tweet Map are able to stay continuously up to date? Or have you wished you knew how to access data from The World Bank’s Open Data project or Data.gov? If so, then you might want to dive into learning about APIs.
In the run-up to TC311: Technology for Data Visualization, I’ve been getting excited about data and APIs. In this brief introduction, we’ll learn the basics of what APIs are, and then how to use Postman, a Google Chrome plugin that can help us access data from APIs. We’ll wrap up by using Postman to retrieve data from the World Bank’s open data API.
So What is an API Anyway?
API stands for Application Programming Interface. At its core, an API allows web servers to communicate with other servers, web browsers, mobile apps, wearables, and almost any other technology you can imagine. APIs allow these devices to transfer data in a predictable way that can be automated.
One way to think about APIs is like an automated telephone directory. For example, if you call the Washington, DC Government’s Information Hotline (311), you won’t immediately speak with a person. First, you’ll be asked if you would like to communicate in English or another language, then you might be asked which service you need to talk about, and then you’re referred to a live person who has the information you need.
APIs operate similarly, except that instead of dialing numbers into a phone to get our information, we use our web browser and a language called HTTP to make a request for data. Just like calling 311 and pressing 1 to speak to someone in English (or 2 for Spanish), we can provide an API with different pieces of information (called parameters) that tell a web server to give us the right information.
The Anatomy an API Call
So how do we actually go about retrieving data from a server? Just as phone numbers follow a specific format (e.g. country code, area code, region, etc.) our API call needs to be made in a specific format. On the internet, this is called HTTP (Hyper-Text Transfer Protocol), and you’ll probably recognize it from the URL bar in your browser.
In fact, if you know how to type a URL (Universal Resource Locator) for a website, you already know some basic HTTP. If you take a look at the screenshot above, you can probably guess that going to https://www.google.com/maps will take us to Google Maps. If you look for a bit longer, you might recognize those numbers after the @ sign as latitude and longitude coordinates. In this example, those coordinates are the parameters that we’re giving the Google Maps API to tell it to display a specific piece of information: a map centered on our current location.
We can think of API calls as being comprised of two pieces: the URL, and parameters (in reality there’s a bit more going on, but we’ll keep things simple for now). In general, a URL represents the location of a web page, and the parameters capture information that we can give to the server when we’re on that page. Let’s go through a few examples:
Here, we’re sending our request to Google Search with the parameter ‘q’ (for query, as in ‘search query’) equal to ‘techchange’. As you might have guessed, this tells Google’s server to execute a search for Techchange and return our results. Lets take a look at another example:
In this case, our parameter ‘t’ (for time) is set to ’30s’ which tells YouTube’s server to play our video, beginning 30 seconds in.
While the specifics of every API are different, the combination of a URL and certain parameters are the basic elements that we need to make an API call. Next up, we’ll see how to use what we’ve learned to make an actual request.
Making an API Call
Want to make an API call to the World Bank right now? You can! Just copy and paste this link into a new browser Window:
http://api.worldbank.org/countries/br/indicators/NY.GDP.MKTP.CD?date=2006
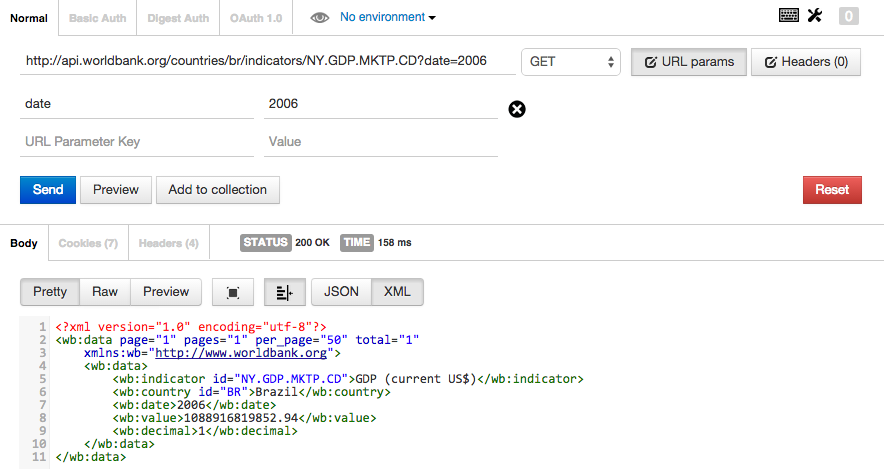
You should get some data back that looks like this:
Pretty simple, right? We just made a call to World Bank’s API and got the GDP of Brazil for 2006 back as data. Lets break down how we got there:
- We called up World Bank’s API (https://api.worldbank.org)
- We specified that we wanted to get the data by country (/countries/), and the specified brazil (the /br/ in our URL)
- Next, we specified GDP using the World Bank’s indicator code: /NY.GDP.MKTP.CD/
- Then, we told the server that we wanted to filter using the date parameter (?date=2006).
- Like magic, the server gave us back the information in an XML format. If we look under <the wb:value> tag, we can see that Brazil’s GDP in 2006 was about $1.089 trillion.
Now, this was a pretty simple request, but you can imagine that if we were typing out really long URLs to access an API, we might want a better tool than our browser’s URL bar.
TechChange’s Tech Team uses Postman to work with APIs. Open Google Chrome and click here to install Postman as an extension from the Chrome Web Store (it’s free!).
Once it’s installed, click on the Apps button in the top left corner of your browser. It looks like this:
Then click on the Postman icon:
You’ll now have a better interface for making API calls. It should look like this:
Making API Calls with Postman
Let’s try re-doing our World Bank API call with Postman. Click on the line labeled “Enter request URL here” and paste in our URL:
http://api.worldbank.org/countries/br/indicators/NY.GDP.MKTP.CD?date=2006
You’ll notice that Postman recognizes the parameter after the ‘?’ on our URL (date=2006) and has displayed it right below our full request. Click the blue “Send” button to make the call and you’ll see the data returned below:
We’re not doing anything differently from before when we simply entered the URL into our browser, but Postman makes this entire process easier, especially when it comes to experimenting with different parameters.
Playing with Parameters
Now that we have a basic sense of how to make an API call, let’s start giving the API more information so that we can customize the data we receive. Unfortunately, we can’t just start typing nonsense for our parameters and expect much to happen. For example, if we ask for the GDP of Brazil and specify food=pizza instead of date=2006, the server won’t be able to filter the results.
This is where API documentation is hugely helpful. An API’s documentation tells people accessing the data the parameters that are valid when they make an API call. Let’s look at the documentation for the World Bank’s API here.
Under the request format section, you’ll see that one of the things we can do is select a date range using a colon:
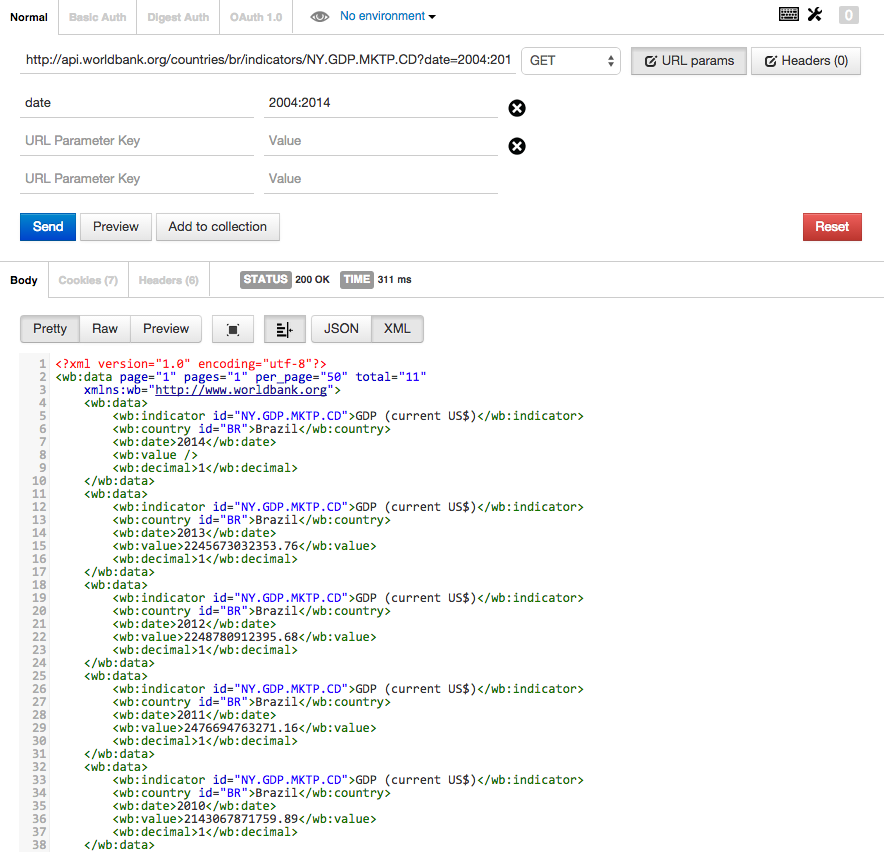
So by passing in date=2004:2014, we can ask the API for a decade of Brazil’s GDP. Let’s do that in Postman:
As you can see, the server understood our API call and returned 10 GDP values from 2004-2014 (cut off in the screenshot).
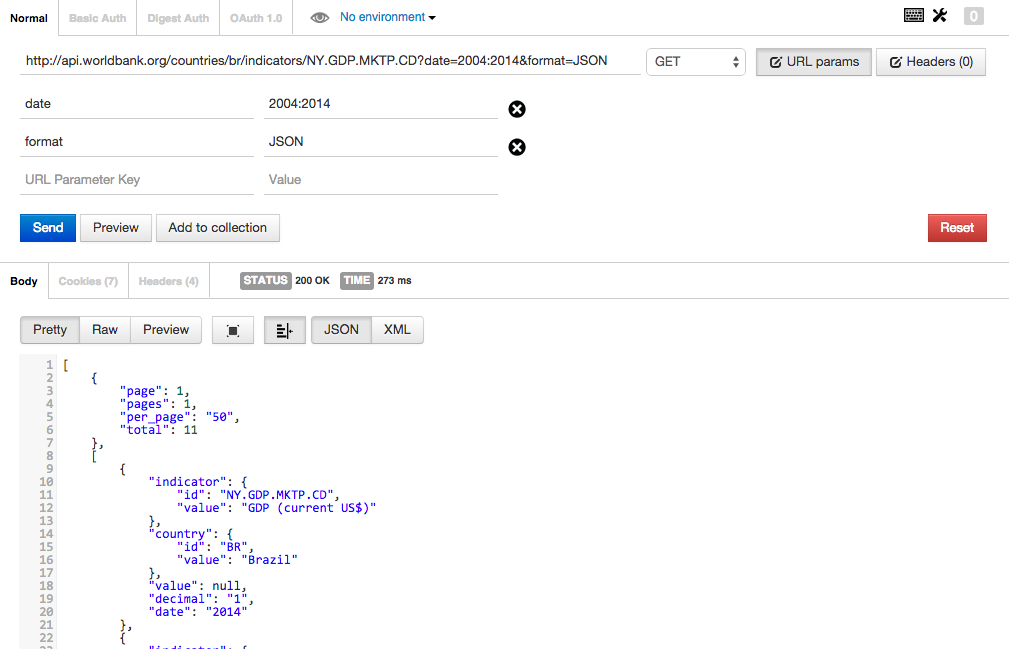
We can also pass in multiple parameters at the same time. The World Bank API returns data in XML by default, be we can change this to JSON (Java Script Object Notation – another data format) by specifying format=JSON. Here’s what that looks like:
We can do all sorts of things from here on out, like specifying a language, listing multiple countries, and even choosing other indicators (The World Bank tracks a lot more than GDP).
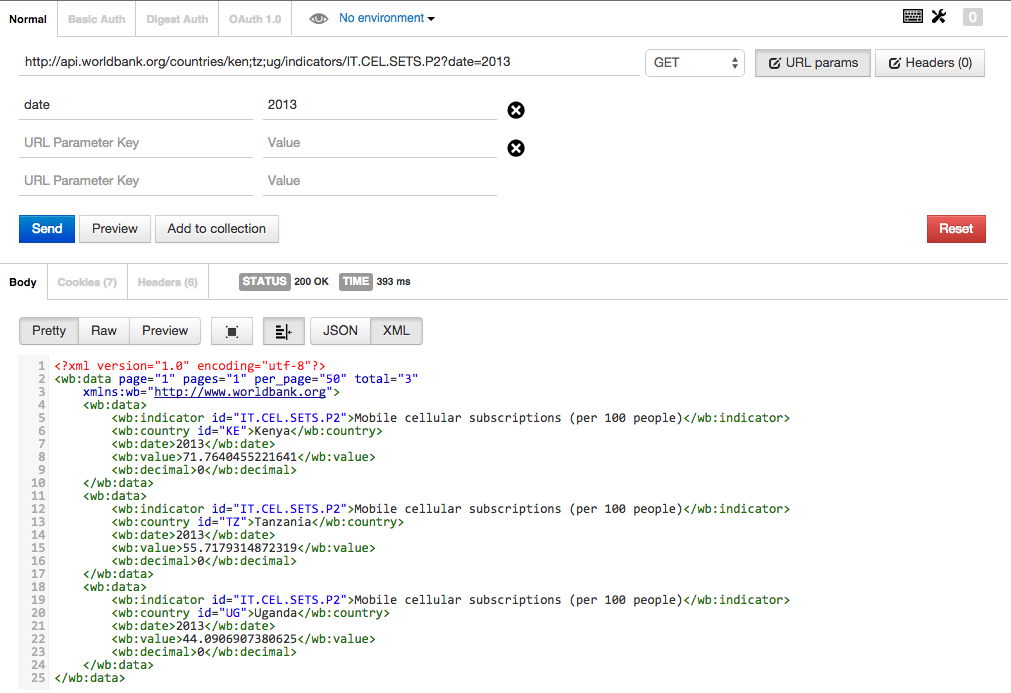
Here’s an example of what an API call looking for cell phone adoption in Kenya, Tanzania, and Uganda (ken;tz;ug in the URL) looks like for 2013:
Bringing it All Together
We’ve learned how to get data from an API, but why is this better than just using an Excel spreadsheet as a data source? Sometimes, Excel might actually be the easiest way to go, but the advantage of an API is that it provides a stream of information that is automatically updated and in a predictable format. Rather than having to manually generate a new graph from a spreadsheet every time the World Bank releases a new set of GDP measurements, we could write a script to gather the most recent information by calling the API.
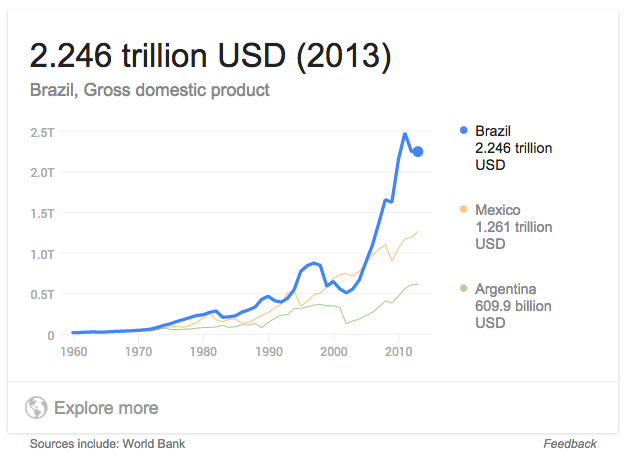
In fact, if you search “GDP Brazil” in Google, you’ll be presented with a live (well, updated yearly) graph that is pulling data from the World Bank’s API:
So what’s next? Well, there are plenty of APIs available to draw data from. As of 2015 there were more than 13,000 APIs listed in Programmable Web’s API Directory, with 3,000 of those APIs were added in the past two years. Using tools like AJAX and JavaScript chart libraries, even simple web applications can create live visualizations that help users understand the data.
Of course, we haven’t even touched on how to think through creating data visualizations. If that topic interests you, be sure to check out TC311: Technology for Data Visualization.


