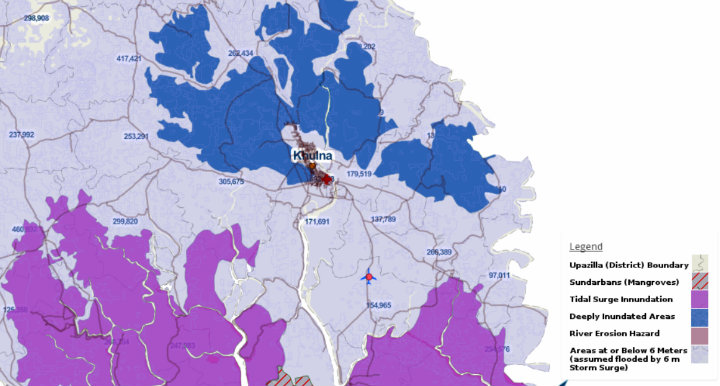
Bob Corbett’s final mapping project on flood-prone areas in Bangladesh. (Note: this map was prepared as a mapping exercise. Anyone viewing the map should understand that it would need to be reviewed and validated by a qualified expert before it should be relied upon.)
By Bob Corbett, TC141: Mapping for International Development alumnus
During my undergraduate work in Landscape Architecture, I learned a method of analyzing spatial data by overlaying various types of information on acetate sheets or tracing paper developed by Ian McHarg, a Scottish landscape architect. The technique is described here (Note: I am not related to the author). I have always been fascinated by this technique and the GIS capabilities available today make this type of analysis readily possible. This offline overlay technique was the basis of my final mapping project in TC141.
In mid-2011, I launched SMS in Action, an Ushahidi Crowdmap that lists text message based programs worldwide that contribute to the social good. To date, nearly 240 programs classified under 29 different categories have been profiled on SMS in Action and viewed by thousands of visitors from 119 countries. With my general interest in mapping piqued by my Crowdmap experience, I ventured into crisis mapping with the Standby Task Force and more recently, Crisismapper deployments using the Tomnod platform. I have since worked on a variety of crisis mapping efforts from locating refugee encampments in Somalia, to tracking forest and bush fires in Colorado and Australia and identifying storm damage after Typhoon Haiyan/Yolanda in the Philippines to name a few.
TC141: Mapping for International Development
Taking the online course, Mapping for International Development, allowed me to combine my interests in ICT4D, international development, data visualization, and a love of maps. I very much enjoyed the format of TC141 with the combination of live presentations, weekly readings and videos, exercises, discussion forums, and the step-by-step instructions and “how-to” materials. Although I tried to “attend” each live presentation the fact that everything was archived for viewing at my convenience was a real plus. This being my first online course, I was surprised at the level of personal interaction available between participants as well as with the facilitator. Chris Neu was a great facilitator: always enthusiastic, arranged interesting presenters and shared an immense amount of information with course participants. I had no specific goals for the course at the outset other than to broaden my knowledge of available mapping technologies. I quickly realized TC141 provided me a chance to gain a capability to work with GIS, a long-term interest of mine. As a result, I selected QGIS, the open source GIS platform as the primary platform upon which to develop my course project.
Mapping with QGIS and MapBox’s TileMill
In a preliminary course exercise we were introduced to MapBox/TileMill. In a follow-up exercise I used MapBox/TileMill to create a simple map of the top ten world coastal cities at risk from flooding due to climate change – including Dhaka, Bangladesh. Given that we have a family friend from Bangladesh, I felt a more detailed investigation of flooding patterns in Bangladesh, an increasingly frequent problem, might lend itself to my major project for the course.
Drawing upon existing sources of information available via the Internet, I located shapefiles for administrative districts, the extent previous flooding, road systems, airport and hospital locations, topographic information, population data and more. After importing this information into QGIS I was able to identify recently flooded and flood prone areas of the country. Seeing how flooding can compartmentalize the country and disrupt the movement of people and relief supplies between areas, I then performed a quick search of key medical facilities and major airports to better understand which would be affected and which might be available to support relief efforts. The QGIS-based flood map was then exported into MapBox/TileMill where it was further refined using the tools and capabilities within the MapBox platform.
Mapping Bangladesh’s Flood-Prone Zones
Given that our Bangladeshi friend is engaged in development activities in the Khulna administrative district, I wanted to see whether flooding in Khulna might impact their area. Based on Internet research, I chose flooding from a 6-meter storm surge as the basis to work from. I then located ground elevation data for Bangladesh and loaded the file into QGIS. By filtering the elevation data I was able to “see” the general extent of flooding that might be expected in Khulna District by a 6-meter storm surge. I was very pleased with the resulting maps and the new skills and capabilities that I had gained. Prior to taking TC141, I was not even aware of QGIS or MapBox/TileMill. I feel compelled to note that my “flood maps” were solely academic mapping exercises and should not be interpreted to be definitive maps of anticipated flooding in Bangladesh. However, it did show me the new capabilities I had developed as a result of TC141.
Mapping in My Future
TC141 offered much more information than I have touched upon here. One area of discussion in the course was OpenStreetMap and Humanitarian OpenStreetMap. With my past involvement with crisis mapping I have developed an interest in pre-disaster planning. Although post-disaster efforts often involve hasty mapping after an event I am interested in what types of information and infrastructure could and should be mapped in advance of disasters as part of a preparedness program. For example, if we believe that climate change is expected to result in an increased frequency and intensity of tropical storms, typhoons, hurricanes, cyclones, etc. shouldn’t first responders and aid agencies have reliable maps to work with prior to a disaster? The Philippines experience, on average, 20 tropical storms per year. Accurate up-to-date maps of facilities and infrastructure needed to recover from such emergencies post-disaster should be mapped in advance in OpenStreetMap as part of a preparedness program. I am interested in learning more about the types of facilities and infrastructure that need to be mapped in advance as part of a preparedness effort and see OpenStreetMap as a logical platform for presenting that information.
Interested in learning how to build your own digital maps using the tools that Bob learned? Enroll now in our 4-week digital mapping course, Mapping for International Development.


