This is a guest post by Matt McNabb, Principal of Caerus Associates. If you are interested in using mapping for digital organizing, consider taking our course Digital Organizing and Open Government.
Today, my colleagues at Caerus Associates and I are able to announce the BETA launch of a new tool that helps businesses, NGOs, and governments collect, visualize, and share geospatial data in less developed emerging markets. We call it, CaerusGEO.
Geospatial in the Last Mile
The premise is simple. How can we leverage the cloud to deliver geospatial analysis to non-GIS users most familiar with basic, paper based workflows?
In our experience, most businesses, government institutions, and organizations in frontier markets rarely use technology across the enterprise. In some cases it’s a cost issue, in others it’s social stigma related. But whatever the reason, ICTs are often used simply to support manual, tabular processes that already exist.
Want to run a survey? Use Word, Excel, and printer.
When it comes to spatial data, this challenge is only magnified. Collecting geospatial information can be hard enough, visualizing and sharing it can be even harder. As a result, geospatial information is often relegated to the expert user. Of course, the GIS industry as a whole is trending towards accessibility, but rarely is it truly meaningful for most enterprises in less developed markets that simply want to know where things happen.
This is what got me interested in a tool widely used within the humanitarian response community called Walking Papers. The value proposition of Walking Papers has been that it extends geospatial data collection to pen and paper. Print off a map, mark it up, then convert what’s written into geospatial data. No magic. No optical character recognition. Just a simple paper insert that allows people without GIS units to collect spatial information in a way that could be easily geo-rectified.
The problem with Walking Papers is that it offers little back to the data collector. There is no visualization or data management. In fact, it’s really only a lightweight tool that lets the user print off a map and, through some gymnastics, let’s her then use it to edit a basemap on Open Street Map. It offers nothing for the non-technical user simply interested in using paper to collect information about events, or perceptions, or whatever other kinds of information one might be interested in seeing over the basemap.
For the past year, we’ve been wondering what it would take to create a tool that filled this gap. Let normal users capture geospatial data in paper formats and return analytical value once collected.
How It Works
This BETA of CaerusGEO is our first answer to this need. A user is able to create her own survey, find a place in the world where it will be centered, create an atlas and data collection sheets through a standard schema they created, and then manage, visualize, and share the data once uploaded. By bridging cloud analytics to paper workflows, we are able to drive value at enterprise level.
If you’re an NGO and want to integrate mapping into your polling, you can create a survey, manage the data, and facilitate sharing from start to finish. If you’re a business looking to understand your market, you can integrate it into your customer registration process and benefit from basic market intelligence. Although basic in form, the value is derived from a more reality-based understanding of workflows in these markets. Paper matters.
Smarter Public Safety
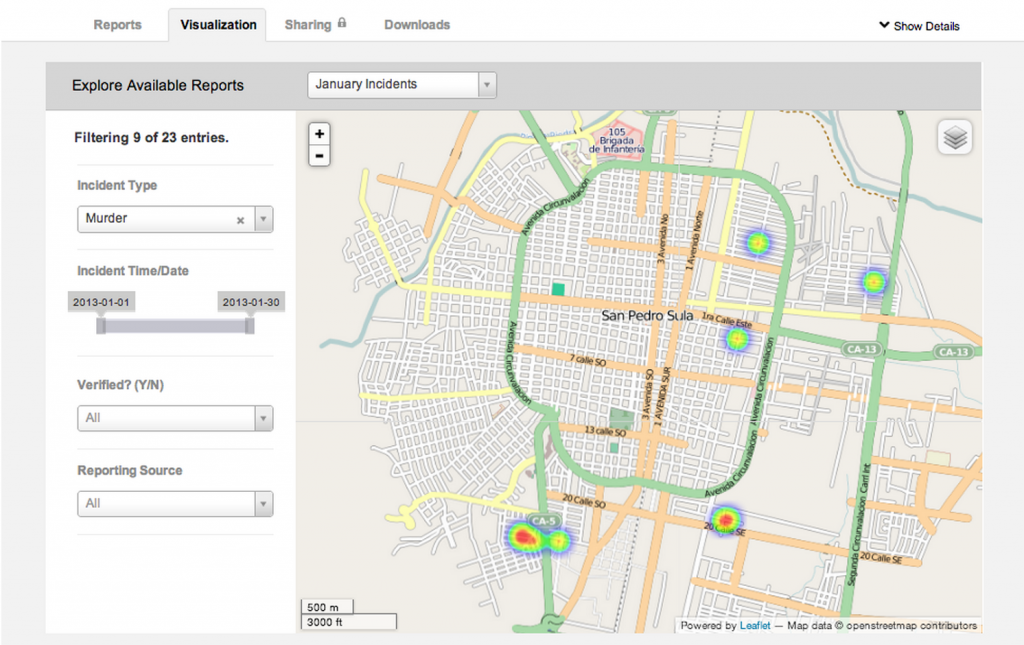
The very first place we thought to experiment was in the domain of public safety. What could be more obvious than the need for taking those antiquated paper and pushpin constructions used for crude crime mapping and making it more dynamic, analytical, and transparent?
As the Deputy Minister of Justice in Monrovia told me, ‘we send the police where the people are, not where the crimes are… this could help us see how to use our resources in a smart way.’ We can address this challenge by finding minimally intrusive places to insert paper maps into the pre-existing workflows of policing institutions and fusing them together for digital analytics by a single node with connectivity to the cloud.
In parallel, NGOs and violence observatories have the capacity to collect and share their own data, creating a basic framework opportunity for enhancing social accountability within the security sector domain. Perhaps most interestingly, by integrating paper-based mapping that connects to real geospatial data, the longstanding art of Participatory GIS in conflict management and of Crime Prevention Through Environmental Design can be used in so many more ways.
Driving Value For The Private Sector
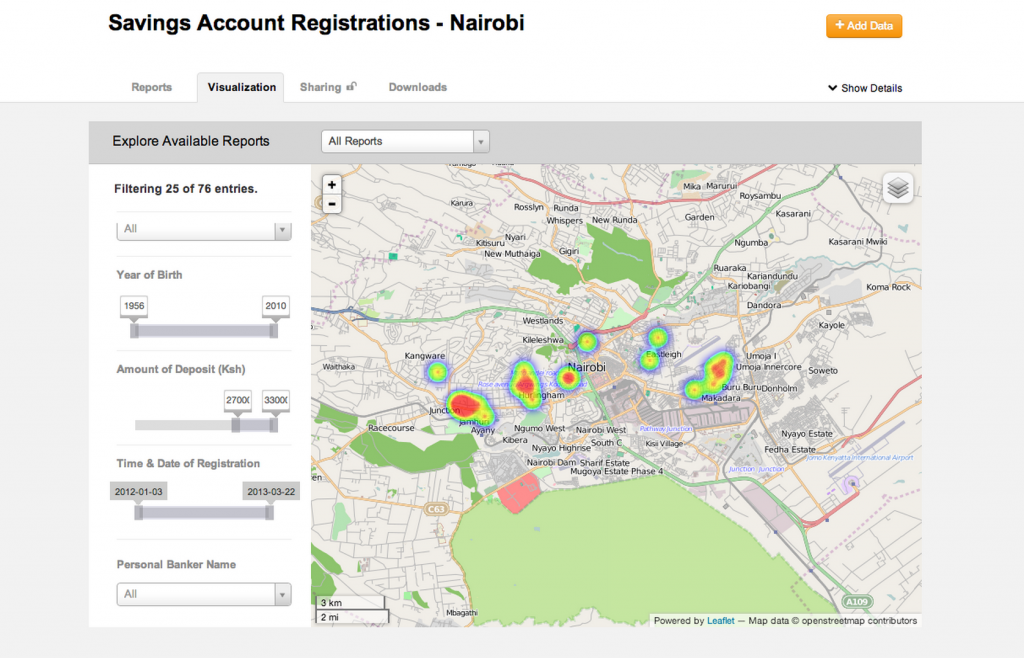
Public safety institutions are not the only ones we have learned can find value here. It’s also a pull for private sector development, particularly in the bottom of the pyramid. Microfinance institutions and others engaged in understanding their customer base face similar challenges.
By extending geospatial data capabilities to private sector development institutions and retail organizations, we have the prospect of significantly improving the precision and reach of private sector particularly to underserved areas.
So Much To Learn
Bending ICTs to the real-world challenges and workflows found in the last mile holds tremendous value to public and private sector institutions alike. For us, this experiment with geospatial information is only the beginning. We hope you’ll join us and give us feedback as our experiment moves on.
Matt McNabb is a member of the Board of Advisors for TechChange, and a Principal with Caerus Associates. For more, you can follow Matt and CaerusGEO on Twitter: @mattrmcnabb @caerusgeo


