Imagine a tool where you have text and a computer automatically highlights key themes. No need to do complex coding, no word counts that are used to explore the text — just keywords and phrases identified. This is exactly what the tool Textio does for job descriptions. It automatically provides an effectiveness score and identifies words and phrases that affect whether applicants will apply for a job: they identify words through color coding that can act as a barrier or incentive, ones that affect applicants based on gender and repetitive terminology. [Editor’s note: TechChange participated in a closed-beta test of the tool and we will write a separate blog post about Textio and hiring practices. This is not a sponsored post.]

This tool not only has great implications for hiring, but utilizes simple visualizations to analyze qualitative data. As Ann Emery and I have been preparing for the Technology for Data Visualization course, we discuss how best to address the topic of data visualization for qualitative data. While there have been data visualizations featured in art museums (e.g., Viégas and Wattenberg’s Windmap), most visualizations are designed to convey information first.

Textio is using a custom algorithm to do a type of sentiment analysis. Typically, sentiment analysis will analyze how positive or negative a text is based on a word’s meaning, connotation, and denotation. Textio, on the other hand, focuses on how effective words or phrases are at getting people to apply for jobs and whether those applicants are more likely to be female or male. Once their specified level of effectiveness or gendered language for a word or phrase is reached, they highlight it with colors based on whether it is positive or negative and/or masculine or feminine. The gender tone of the entire listing is shown along a spectrum.

Acumen, a tool created at Al Jazeera’s 2014 Hackathon: Media in Context, is another take on how to visualize sentiment analysis. With a focus on trying to uncover bias in news articles, they highlight how positive or negative an article is in relation to other articles on the topic. A separate analysis tab shows shows the two sentiment ratings on a spectrum and ‘weasel words,’ words that are indicative of bias in reporting. The viewer also has the option to highlight the weasel words in the news article.

Both Textio and Acumen are great examples of how qualitative data visualization can be used to aid in the analysis of text. Neither example is immediately suited for generalized needs and require programming knowledge to create a particularized purpose, which myself and Kevin Hong will discuss in a forthcoming blog post. Instead, they can be used as examples of how qualitative data can be visualized to help inform decision making.

Have you used Textio or Acumen? Share your thoughts with us below or by tweeting us at @techchange!

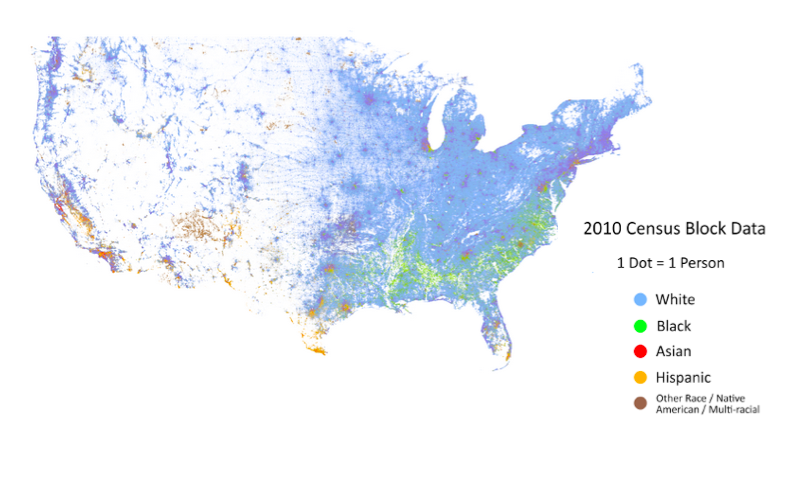
Image Source: AidData

How do you analyze data you collect from surveys and interviews?

One way to analyze data is through data visualizations. Data visualization turns numbers and letters into aesthetically pleasing visuals, making it easy to recognize patterns and find exceptions.

We understand and retain information better when we can visualize our data. With our decreasing attention span (8 minutes), and because we are constantly exposed to information, it is crucial that we convey our message in a quick and visual way. Patterns or insights may go unnoticed in a data spreadsheet. But if we put the same information on a pie chart, the insights become obvious. Data visualization allows us to quickly interpret the data and adjust different variables to see their effect and technology is increasingly making it easier for us to do so.

So, why is data visualization important?

Patterns emerge quickly

Cooper Center's Racial Dot Map of the US
Cooper Center’s Racial Dot Map of the US

This US Census data (freely available online for anyone) is geocoded from raw survey results. Dustin Cable took the 2010 census data and mapped it using a colored dot for every person based on their race. The resulting map provides complex analysis quickly.

It is easy to see some general settlement patterns in the US. The East Coast has a much greater population density than the rest of America. The population of minorities is not evenly distributed throughout the US with clearly defined regional racial groupings.

Exceptions and Outliers are Made Obvious

San Luis Obispo, CA

As you scan through California, an interesting exception stands out just north of San Luis Obispo. There is a dense population of minorities, primarily African-Americans and Hispanics. A quick look at a map reveals that it is a men’s prison. With more data you can see if there are recognizable patterns at the intersection of penal policy and racial politics.

Quicker Analysis of Data over Time


Google Public Data Explorer

Google’s dynamic visualizations for a large number of public datasets provides four different types of graphs, each with the ability to examine the dataset over a set period of time. It is easy to see patterns emerge and change over time. Data visualization makes recognizing this pattern and outliers as easy as watching a short time-lapsed video.

What are some of your favorite data visualizations examples or tools, tweet at us @TechChange or share in the comments section below.

If you are interested in learning about how to better visualize and analyze data for your projects, join us in our new online course on Technology for Data Visualization and Analysis. The course begins on June 1, so save your seats now!

Are you interested in learning with TechChange? Check out our next class: Digital Organizing and Open Government. Class starts April 8, 2013. Apply Now.

How can USAID use mobile technologies to more effectively collect, analyze and share data?  These are the central questions we will be addressing as part of a new course TechChange has developed in partnership with the Mobile Solutions team at USAID and QED.

USAID, together with its partners, has the opportunity to increase efficiency, improve the quality of the information its uses, and better meet USAID goals related to its Forward Reforms, Evaluation Policy, and Open Data Initiative by utilizing mobile technologies to collect and disseminate data about people, projects, and programs. This course will help USAID Missions and implementing partners understand how to do just that.

Building off of the success of our 8-week online certificate course this fall on Accelerating Mobile Money, TC311 Mobile Data Solutions will be a four week online course (February 1-March 1, 2013) designed to build the necessary technical capacity to deploy mobile data collection strategies by bringing together Mission staff and implementing partners. The four weeks are structured as follows to provide a comprehensive overview of mobile devices in data collection.

Week 1: Introduction to mobile data solutions

  • What is mobile data? What are the benefits and challenges associated with collecting data wirelessly?

Week 2: Project design

  • Designing projects and preparing concept notes, scopes of work, other documents to include mobile technologies.

Week 3: Implementation

  • Study design and programming, training, field operations, data management

Week 4: Analysis, visualization and sharing

  • Utilizing data for decision-making, sharing with partners

The course will go beyond explaining the benefits of this approach. Participants will learn the questions to ask in order to assess projects (Are mobile technologies appropriate?); design them to achieve the maximum benefits possible (How should interventions be designed to take advantage of these technologies?), implement them (What device should we use? How do we train staff? What resources do we need in the field? At the Mission?), and report and share the data (How do we create visuals that can inform decision making? How do we share the results with beneficiaries and partners in-country?).

Featured tools, organizations and projects include: Episurveyor/Magpi, FormhubSouktel, EMIT, uReport, TexttoChange, RapidSMS, GeoPoll, iFormbuilder, PoiMapper, Catholic Relief Services, DAI, NASA, OpenDataKit at UW, SweetLab, JSI, ICF International, Tangerine at RTI, Futures Group. The course will be delivered on TechChange‘s custom learning platform and will include a mixture of presentations by experts, tool demonstrations, selected readings, and activities including designing and analysing a survey using mobile software.

This closed course is intended specifically for USAID and its implementing partners. But if are you interested in learning with TechChange and the topic of mobile data, Check out our upcoming course on Mobile Phones for International Development. Class starts on March 4, 2013. Apply now!