In June 2014, we wrapped up the second round of our Mapping for International Development online course. Nearly 60 participants joined us from Rwanda, Ethiopia, Benin, Mozambique, Australia, Kenya, Haiti, Thailand, France and 10 more countries. They represented organizations like Oxfam, Korea NGO Council for Overseas Development, Chemonics, Danish Demining Group, Abt Associates, and many more.

Before we start our next Mapping for International Development online course on Monday, we took a look back at the previous round of the course. Here are a few things we learned together:

1. Learning to create a map is much more than learning about mapping tools

In this mapping course, the participants were introduced to mapping tools beyond just Google Maps Engine, like Tomnod, Crowdmap, OpenStreetMap, and many more. But before diving into the tools, we kicked off our mapping course with a lively discussion on an ongoing debate about the power of amateur cartographers in telling their story by mapping their own communities.

In a course with various levels of mapping experience, this discussion was definitely a highlight of the course. Tom Mueller, a GIS professor at California University of Pennsylvania, pointed out in the course that “all maps are telling a story.” And the discussions in this first week made clear the participants’ view that the communities being mapped should have the power to tell their own story, whether it means creating their own maps or choosing not to be on a map.

Some of the participants were being introduced to thinking about the ethics of mapping for the first time through this mapping course. Participants grappled with questions like who is or is not represented on a map, is a map biased, what story is a map telling, who made the map and why.

Mapping for International Development was much more than a class on how to use different mapping tools (for that, there are already many tutorials available online) but rather an excellent overview of the current debates regarding mapping for international development and current ongoing experiences.Fabien Maitre-Muhl, who works in the Community Violence Reduction section of UN Stabilization Mission in Haiti

2. The best maps require collaboration

Like the global digital mapping community, the participants and guest experts learned from each other in this mapping course. Nine guest experts joined us from OpenStreetMap, Tomnod, Ushahidi, GIS Corps and other organizations that crowdsource the talent of mapping volunteers to create better maps. The active engagement of almost 60 participants amongst each other and the guest experts made the four weeks of the course a great learning experience for everyone.

After the first week, we discussed the different tools used to create maps, and participants had a chance to share the maps they were working on. They were able to see each other’s work and find ways to collaborate and learn from each other’s experience. Tom Mueller’s final project for the course was creating a mapping project for his students where they used social media to map ongoing crises around the world. He created the project by getting feedback and suggestions from the other participants in the Mapping for International Development course.

“Thanks to all the other course participants. There were some really interesting posts in the forums and obviously some fascinating and important development and humanitarian work is going on around the globe. The course certainly raised my awareness about the role that mapping can play in this work, as well as the kinds of barriers and challenges that mappers have to negotiate in a range of social situations.” – Gary Scott at Australia Central Land Council

“I have effectively learned how to create an interactive map using tools such as QGIS and TileMill starting from nothing thanks to this course.” – Mattia Zanazzi at the UN Stabilization Mission in Haiti

3. Mapping makes the invisible visible

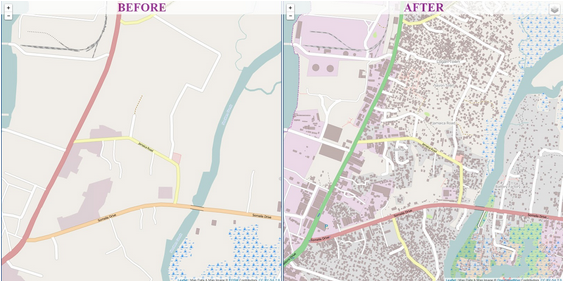
Fabien Maitre-Muhl, one of the course participants noted that, “mapping helps make the invisible visible.” Increasingly, digital mapping is becoming important in expediting humanitarian response as it is crucial to reach the population most affected by crisis in the most remote areas. During the Ebola crisis, OpenStreetMap helped map the affected areas to make tracing the outbreak easier.

Monrovia OSM pre-Ebola

Map of Monrovia in OpenStreetMap before and after volunteers mapped the city in response to the Ebola crisis. (Humanitarian OpenStreetMap)

Mapping can also help visualize the impact of international development projects. Mira Gupta, a TechChange alumna from the previous Mapping course “used election maps to illustrate to [her] research team that once geocoded there might in fact be very distinct geographical trends in the data” for a maternal and neonatal health qualitative study.

The last Mapping for International Development online course introduced the participants to various mapping tools, and more importantly, facilitated engaging conversations among people with varied levels of expertise from all over the world, and helped them get a better sense of the mapping needs and impacts for projects they were working on.

More than two dozen participants from 13 different countries have already enrolled in our upcoming Mapping for International Development online course, representing organizations such as Oxfam, Deloitte, Helen Keller International, United Nations, International IDEA, Vera Solutions, PwC, and more!

You can join us too! Sign up today for our Mapping for International Development online course, that begins Monday, March 2.

How can mapping the geolocations of tweets tell a story about global atrocities? How can digital mapping be integrated as a learning tool for university classes?

As part of his final project for TechChange’s online course, TC141: Mapping for International Development in Spring of 2014, GIS professor Tom Mueller wanted his students to explore these topics. In Professor Mueller’s course, “Introduction to Geography” at the California University of Pennsylvania in Pittsburgh, he had his students look for patterns in social media during humanitarian crises such as Ebola outbreaks and conflict casualties, and visually display the spatiality of those events.

Throughout the semester, Tom held several discussions with his students on various topics using social media to map out crises. In his course’s final assignment, Tom had about 100 students in the geography class work in groups to map various Sudan/South Sudan incidents by following several Twitter handles and categorized tweets. After examining their papers, he decided to ask them to choose a country and possibly use CrisisNet as several students became more concerned about gathering tweets rather than the information itself. He felt students would take more ownership of their projects if they independently selected their country, region or topic of choice. So, he is having them search topics on CrisisNet to understand the information that can be part of a tweet. Subsequently, they will examine some news sources and choose a country, topics, etc.

We sat down with Tom Mueller to learn more about incorporating digital mapping into his university class.

1. What is your background in mapping? What interested you in taking TechChange’s Mapping for International Development class?

I have been a GIS professor at a small school just southeast of Pittsburgh called California University of Pennsylvania. I read about crisis mapping and wanted to learn more. When I read about TechChange’s Mapping for International Development online course, it seemed like a great way to acquire more knowledge.

2. What were the most useful tools that you became familiar with in Mapping for International Development online course? How are you applying what you’ve learned in the class?

The two most important tools I found to be useful were MapBox and CrisisNet. While I encouraged my students to use ArcGIS Online in my course, learning about MapBox and its use cases helped me see the connection. It made me realize that this type of project could work with an introductory class with no GIS experience since all we needed was
latitude and longitude of the location. This may sound silly, but after going through it on MapBox, I thought I can do this in ArcGIS Online.

Now I know I should have realized it before but going through the process let me step back and understand the power this project might have on the students.
Hopefully, they understand the power of location, social media, etc.

The most important aspect of the Mapping for International Development course was the feedback from the global class participants and TechChange instructors. It was their discussions that helped me design the project guidelines to let students follow certain Twitter accounts to gather information and attempt to investigate locations based on those tweets.
All the topics we discussed in the TechChange online course helped me to understand the beginnings of this type of geographical analysis and build my ideas. As I started formulating my ideas, I could put this information on the discussion board and the TechChange course participants would give me their comments, and suggestions or ask questions. All this information allowed me to build my university class project from the ground up for my own students.

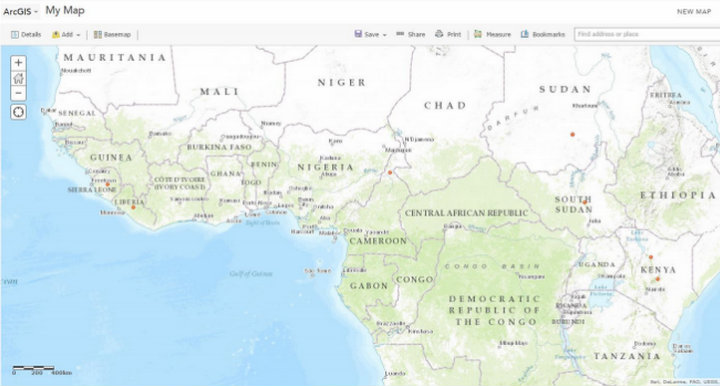
An ArcGIS map produced by one of Tom Mueller’s students indicating the locations of early Ebola incidents.

An ArcGIS map produced by one of Tom Mueller’s students indicating the locations of early Ebola incidents.

3. What inspired you to create this digital mapping exercise for your university students?

In my “Introduction to Geography” class at California University of Pennsylvania in Pittsburgh, my students and I examine geography through a global and regional lens. Sometimes geography might not be the most attractive topic for students, so I needed a hook to pique their interest. Humanitarian issues and genocide seemed to catch the students attention the most. I also knew that the situation in Sudan / South Sudan was active and the students would be able to get a lot more current information from Twitter than other sources.

4. How did your students respond to the digital mapping exercise? What were the results?

My students really enjoyed the assignment as it allowed them to learn about an unfamiliar part (at least to them) of the world. A few students said they could not believe the issues in this area since it did not seem that the popular media was covering the events. If I include a digital mapping exercise again in future classes I teach, my only change would be to may let them choose a developing country and use CrisisNet as their data source. Then they would present their findings to the rest of the class.

5. What is your advice for other professors looking to incorporate digital mapping/blended learning (offline +online) into the courses they offer at universities?

Professors need to be flexible when experimenting with new technology tools in the classroom. For this project, we changed our plans slightly about three times based on conversations with the students and events around the world. The key for my class was not to write a “thesis”; it was for students to understand the power of social media during crises and the spatiality of those events.

About Thomas Mueller

Tom-Mueller

Dr. Thomas R. Mueller is a professor at the Department of Earth Sciences at the California University of Pennsylvania and an alumnus of TechChange’s Mapping for International Development online course. His research agenda has grown dramatically throughout his career at California University of Pennsylvania. He applies spatial theory to the real world, particularly using Geographic Information Systems. His key to building a successful research agenda is to produce work through a variety of scholarly endeavors, including conference presentations, grants, technical reports, book reviews and publications in professional journals. He also has taught numerous GIS workshops for members of the local community, professors at Cal U and other campuses, and for the K-12 community.

Interested in learning different digital mapping tools for the context of humanitarian crises around the world? Enroll now in our upcoming Mapping for International Development online course.

PreMAND field workers testing data collection tablets in Navrongo, Ghana (Photo: N. Smith)

Mira Gupta, one of the star alumna of our courses on Mapping for International Development and Technology for Monitoring & Evaluation (M&E), is a Senior Research Specialist at the University of Michigan Medical School (UMMS). Last October, USAID awarded UMMS $1.44 million to assess maternal and neonatal mortality in northern Ghana. This 36-month project, “Preventing Maternal and Neonatal Mortality in Rural Northern Ghana” (also referred to as PreMAND: Preventing Maternal and Neonatal Deaths) will help USAID, the Ghana Health Service, and the Ghana Ministry of Health design interventions to prevent maternal and neonatal mortality by investigating the social, cultural and behavioral determinants of such deaths across four districts in northern Ghana. For this project, UMMS will be partnering with the Navrongo Health Research Centre and Development Seed.
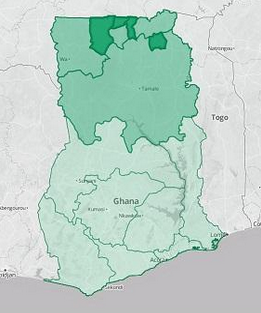
Project Regions and Districts

Project Regions and Districts

We sat down with Mira to learn more about this project and how her TechChange trainings in digital mapping and technology for M&E gave her the skills and background she needed to develop her team’s project in Ghana.

1. What interested you in taking the Mapping for International Development and the Tech for M&E online courses?
I was in the process of trying to learn everything I could about our GIS options when I heard about TechChange’s Mapping for International Development course. It provided a fantastic introduction to the range of approaches being used on international development projects and the variety of organizations working in that space. The course material helped me identify which types of visualizations would be most appropriate for my team’s research. I especially benefited from the many sectors represented in the TechChange sessions because while I was trying to create a project for the Health sector, I actually learn best through a Democracy and Governance framework given my previous background in this field. TechChange provided access to mapping specialists in both areas through its instructors and other class participants.

Just as I heard of the mapping course right as I needed it, the same thing happened again with the Technology for M&E course, which I took a year later. By that point, the PreMAND project had just been awarded and I learned that I would be responsible for the evaluation components. I was excited to take the TechChange course because I knew it would provide a great overview of the many different tools being used, and that I would benefit immensely from the participation of classmates working on projects in similar settings. As expected, the content presented was incredibly valuable in informing our project approach in terms of our field data collection, methods of analysis, and presentation of findings.

2. How did the mapping component of this USAID-funded project come together?

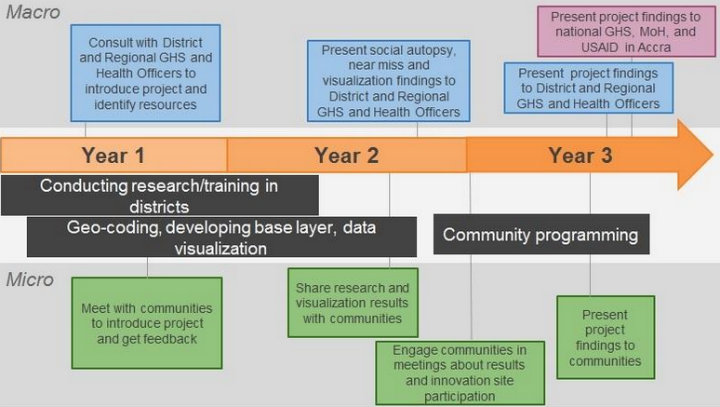
The Three Project Phases: Research will inform the visualisations, which will inform programming

The Three Project Phases: Research will inform the Visualisations, which will inform Programming

While working on a maternal and neonatal health qualitative study a couple of years ago, I sensed that there were themes and patterns in the data that were difficult to verify since the locations of the respondents had not been geocoded. Some of the variables indicated 50/50 probabilities of any particular outcome, which seemed to suggest that there was no pattern whatsoever when viewed as a large dataset. Because my background is in Democracy and Governance, I used election maps to illustrate to my research team that once geocoded there might in fact be very distinct geographical trends in the data, drawing parallels to the locational breakdown of political party support in the United States.

I was in the process of researching mapping resources when I first heard about the TechChange’s Mapping for International Development course, and through the course I met some of the mapping experts that ultimately served as key resources in the development of our project strategy. The course gave me the necessary base knowledge to effectively liaise between our health researchers and the mapping experts to determine the best approach to meet our data visualization needs. We were extremely fortunate to have USAID-Ghana release a call for outside-the-box submissions under its Innovate for Health mechanism, right as we were developing our program concept.

3. What are the biggest challenges you anticipate in undertaking this project?
For the visualization component, generating the base layer maps will be more difficult than we originally anticipated. The various pieces of data we need are spread throughout different government sources such as the Ghana Statistical Service, the Lands Commission, and the Ministry of Roads and Highways. We will need to consult with each of these groups (and likely many others), to explore whether or not they will allow their data to be used by our project. It will require some agility on our part, as we need to stay flexible enough so that we collect any outstanding geographic data we may need through our team of field workers. While there are many moving pieces at the moment, it’s exciting for us to think that we’re building what may be the most comprehensive geographic base layer map of the region, as an initial step in developing our health indicator analysis tool.

There are also a handful of challenges related to evaluation. The primary purpose of our project is to provide new information to clarify the roles of social and cultural factors in determining maternal and neonatal deaths, and shed light on a valuable set of drivers which up until now have been unclear. We are currently in the process of finalizing our M&E framework, which has been a complex process because our project doesn’t fit the mold that most performance indicators are designed for. As a result we’ve been carefully drafting our own custom indicators through which we’ll measure our project’s progress and impact.

One of our most interesting evaluation challenges has been the development of our Environmental Mitigation and Monitoring Plan, which is traditionally intended as a tool for implementing partners to take stock of the impacts their work could have on the natural environment. In our case, we’re using it as a tool to think through our ethical approach to the potential impact of our project on the social and cultural landscape, given the challenges associated with collecting very sensitive health information and the need for data privacy. It’s pushing our team to think through every step of our project from the perspective of our various stakeholders, and has yielded many valuable insights that have strengthened our program approach.

4. What are the tools that you became familiar with in Mapping for International Development and M&E and plan on using in this project and how will you apply them to your project?
I came into Mapping for International Development knowing very little about the resources available in that space. Several of the tools that I became familiar with through the class, such as OpenStreetMap, MapBox and QGIS were highly applicable to our project in Ghana. After participating in the session led by Democracy International and Development Seed, I reached out to those instructors for their input on how I could best translate my project concept into actionable steps.

The visualizations I hoped to create were complex enough that I soon realized it would make the most sense for our research team to work directly with a mapping firm. We were so impressed by the technical feedback and past projects of Development Seed that we established a formal partnership with them and worked together to refine the vision for the project that was ultimately funded. TechChange’s training gave me the knowledge I needed to select the right partner and understand how best to combine our research goals with the available mapping resources to maximize our project’s impact.
Programs used on the PreMAND project

Programs used on the PreMAND project

In Technology for M&E I learned about the capabilities of different devices, survey apps—those able to capture geodata were of particular interest to me—and even project management tools. There were many helpful conversations both in the class sessions as well as in the participant-led threads around the data collection process, data privacy, and the ways in which project findings can be best communicated to a variety of stakeholder groups. What I found to be most relevant and applicable to our Ghana project were the conversations surrounding human-centered design, and the use of rich qualitative data. I gained a lot from the session led by Marc Maxson of GlobalGiving, who discussed which forms of data are the richest and easiest to interpret. The University of Michigan and our partner the Navrongo Health Research Centre already excel in qualitative data collection techniques, but the conversations throughout the TechChange M&E course inspired some new ideas as to how we might incorporate multimedia such as video and photographs in our qualitative data collection process to make our project deliverables that much more substantive.

5. What is your advice for researchers working to integrate more data visualization and mapping in their research and project interventions?
My advice would be to focus on the end user of your data and identify their needs and interests early in the process. That clarity can then be used to inform 1) what content will be most useful, and 2) what presentation format(s) will be most effective. It’s important to do some form of a needs assessment and let stakeholder feedback guide the project’s design.

In the case of our Ghana project, we are implementing a two-prong approach to our visualizations because both the government representatives and our donor will find an interactive web application most useful, while local community members in the rural North will benefit more from group discussions centered around printed maps.
Feedback loop with two stakeholder groups: the government of Ghana and local communities

Feedback loop with two stakeholder groups: the government of Ghana and local communities

It is common to sometimes present health indicator data solely as points on a map, but we are designing our visualizations to be much more detailed with background layers including health facilities, schools, compounds and roads so that those viewing the health indicator data can orient themselves a bit better to the local context. Had our end-users only been the leaders of those individual communities such detailed maps may not have been necessary. Similarly, the visualizations for one stakeholder group might incorporate a lot of words or even narrative stories based on their level of education, while for other stakeholders, those visualizations will be more image-based and we’ll orient them to the maps through presentations in their local communities.

About Mira Gupta

Mira Gupta

Mira Gupta is a Senior Research Specialist at the University of Michigan Medical School (UMMS), where she focuses on program design, strategy and evaluation. She has developed successful international aid projects in 18 countries, including 13 in Africa. Mira began her career in the Democracy and Governance sector where she worked for organizations such as IFES, the National Democratic Institute, and the Carter Center. She also developed projects in the Economic Risk and Conflict Mitigation sectors before transitioning into Global Health. Her research on the effects of local power dynamics on health-seeking behavior in northern Ghana is published the current edition of Global Public Health.
In our modern times of media cycles fighting for our short attention spans, it is easy to ride the momentum of a highly visible campaign that can quickly fizzle out once another competing story emerges. Since the kidnappings of approximately 300 Nigerian girls by militant Islamist group Boko Haram last month, the international community has embraced the hashtag, “#BringBackOurGirls”, in a very vocal and visible social media campaign demanding action to rescue the Chibok girls. But one month since the mass kidnapping without the rescue of the girls, do we need to take a different approach? Will #BringBackOurGirls be just another campaign we forget about once the next celebrity scandal becomes breaking news?

#BringBackOurGirls goes global starting in Nigeria

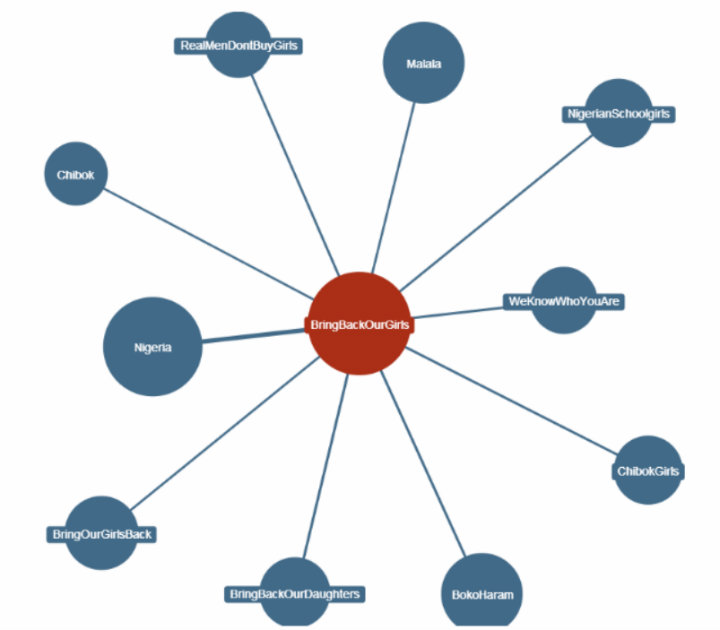
Most of the #BringBackOurGirls campaign activity has been highly visible on Twitter, Facebook, and international media outlets. In this fascinating Twitter heat map created using the tool, CartoDB, featured in TIME Magazine, we can see a time-lapsed digital map of how the hashtag, “#BringBackOurGirls” spread globally, starting organically from within Nigeria in mid April.

(We’ll be touching upon CartoDB, and other digital mapping tools in our upcoming Mapping for International Development course later this month.)

The #BringBackOurGirls hashtag has been embraced widely by many public figures and has garnered wide support across the world. Michelle Obama, David Cameron, and Malala Yusafzai have posted images with the hashtag, along with celebrities such as Ellen Degeneres, Angelina Jolie, and Dwayne Johnson. To date, nearly 1 million people signed the Change.org petition. Countries including the USA, UK, China, Israel have pledged to join the rescue efforts, and other human rights campaigns have joined the #BringBackOurGirls Twitter momentum, as seen on this Hashtagify map.

hashtagify #BringBackOurGirls

Is #BringBackOurGirls repeating the mistakes of #KONY2012?

Kony_2012_Poster_3

A great example of a past campaign where this happened was with the KONY2012 campaign, which brought some albeit short-lived urgency to addressing the child soldiers recruited by Joseph Kony, leader of the Lord’s Resistance Army (LRA). Michael Poffenberger, who worked on that campaign, will join us a guest expert in TC110: Social Media for Social Change online course in June 2013 and compare it the current #BringBackOurGirls campaign. Many have drawn parallels to both campaigns and warned of the false optimism that hyped social media messages can bring when context is not fully considered and understood.

According to Lauren Wolfe of Foreign Policy magazine, “Understanding what has happened to the Nigerian girls and how to rescue them means beginning to face what has happened to hundreds of thousands, if not millions, of girls over years in global armed conflict.” To some critics, this hashtag trivializes the weaknesses of Nigerian democracy that have been exposed. Critics of using social media in advocacy campaigns have used the term “slacktivism” to describe the passive, minimal effort needed to participate in these movements. Others have cited such media waves being exploited for individual gain, as opposed to genuinely benefiting the girls. Florida State University Political Science professor, Will H. Moore, argues that this hashtag activism is not only hurting the larger cause of rescuing the kidnapped girls, but actually helping Boko Haram. Jumoke Balogun, Co-Founder of CompareAfrique, also highlights the limits of the #BringBackOurGirls hashtag impact.

Hashtag activism, alone, is not enough

With all this social media activity and international press, what actual progress has been made in rescuing the kidnapped girls? If the objective is raising awareness of the issue, yes, the hashtag has been successful. If the objective is to rescue the girls, we still have a long way to go, even if the hashtag campaign has been part of a multi-pronged approach to galvanize resources into action.

The bottom line: social media can be a powerful tool to bring visibility and awareness to a cause, but a hashtag alone is not enough to bring about social change. There are a myriad of resources that must be coordinated to effectively implement this rescue mission, which will only become more difficult as more time passes. However, prioritizing and shining a sustained light on the problem, instead getting distracted by competing media cycles on celebrities getting into petty fights, is the first step toward a solution.

===

What do you think about the impact of the #BringBackOurGirls campaign? We’re only scratching the surface here on the topic of social media for social change and invite you continue the discussion with us in our upcoming Social Media for Social Change online course which runs June 16 – July 11, 2014.

Bob Corbett’s final mapping project on flood-prone areas in Bangladesh. (Note: this map was prepared as a mapping exercise. Anyone viewing the map should understand that it would need to be reviewed and validated by a qualified expert before it should be relied upon.)

By Bob Corbett, TC141: Mapping for International Development alumnus

During my undergraduate work in Landscape Architecture, I learned a method of analyzing spatial data by overlaying various types of information on acetate sheets or tracing paper developed by Ian McHarg, a Scottish landscape architect. The technique is described here (Note: I am not related to the author). I have always been fascinated by this technique and the GIS capabilities available today make this type of analysis readily possible. This offline overlay technique was the basis of my final mapping project in TC141.

In mid-2011, I launched SMS in Action, an Ushahidi Crowdmap that lists text message based programs worldwide that contribute to the social good. To date, nearly 240 programs classified under 29 different categories have been profiled on SMS in Action and viewed by thousands of visitors from 119 countries. With my general interest in mapping piqued by my Crowdmap experience, I ventured into crisis mapping with the Standby Task Force and more recently, Crisismapper deployments using the Tomnod platform. I have since worked on a variety of crisis mapping efforts from locating refugee encampments in Somalia, to tracking forest and bush fires in Colorado and Australia and identifying storm damage after Typhoon Haiyan/Yolanda in the Philippines to name a few.

TC141: Mapping for International Development

Taking the online course, Mapping for International Development, allowed me to combine my interests in ICT4D, international development, data visualization, and a love of maps. I very much enjoyed the format of TC141 with the combination of live presentations, weekly readings and videos, exercises, discussion forums, and the step-by-step instructions and “how-to” materials. Although I tried to “attend” each live presentation the fact that everything was archived for viewing at my convenience was a real plus. This being my first online course, I was surprised at the level of personal interaction available between participants as well as with the facilitator. Chris Neu was a great facilitator: always enthusiastic, arranged interesting presenters and shared an immense amount of information with course participants. I had no specific goals for the course at the outset other than to broaden my knowledge of available mapping technologies. I quickly realized TC141 provided me a chance to gain a capability to work with GIS, a long-term interest of mine. As a result, I selected QGIS, the open source GIS platform as the primary platform upon which to develop my course project.

Mapping with QGIS and MapBox’s TileMill
In a preliminary course exercise we were introduced to MapBox/TileMill. In a follow-up exercise I used MapBox/TileMill to create a simple map of the top ten world coastal cities at risk from flooding due to climate change – including Dhaka, Bangladesh. Given that we have a family friend from Bangladesh, I felt a more detailed investigation of flooding patterns in Bangladesh, an increasingly frequent problem, might lend itself to my major project for the course.

Drawing upon existing sources of information available via the Internet, I located shapefiles for administrative districts, the extent previous flooding, road systems, airport and hospital locations, topographic information, population data and more. After importing this information into QGIS I was able to identify recently flooded and flood prone areas of the country. Seeing how flooding can compartmentalize the country and disrupt the movement of people and relief supplies between areas, I then performed a quick search of key medical facilities and major airports to better understand which would be affected and which might be available to support relief efforts. The QGIS-based flood map was then exported into MapBox/TileMill where it was further refined using the tools and capabilities within the MapBox platform.

Mapping Bangladesh’s Flood-Prone Zones
Given that our Bangladeshi friend is engaged in development activities in the Khulna administrative district, I wanted to see whether flooding in Khulna might impact their area. Based on Internet research, I chose flooding from a 6-meter storm surge as the basis to work from. I then located ground elevation data for Bangladesh and loaded the file into QGIS. By filtering the elevation data I was able to “see” the general extent of flooding that might be expected in Khulna District by a 6-meter storm surge. I was very pleased with the resulting maps and the new skills and capabilities that I had gained. Prior to taking TC141, I was not even aware of QGIS or MapBox/TileMill. I feel compelled to note that my “flood maps” were solely academic mapping exercises and should not be interpreted to be definitive maps of anticipated flooding in Bangladesh. However, it did show me the new capabilities I had developed as a result of TC141.

Mapping in My Future
TC141 offered much more information than I have touched upon here. One area of discussion in the course was OpenStreetMap and Humanitarian OpenStreetMap. With my past involvement with crisis mapping I have developed an interest in pre-disaster planning. Although post-disaster efforts often involve hasty mapping after an event I am interested in what types of information and infrastructure could and should be mapped in advance of disasters as part of a preparedness program. For example, if we believe that climate change is expected to result in an increased frequency and intensity of tropical storms, typhoons, hurricanes, cyclones, etc. shouldn’t first responders and aid agencies have reliable maps to work with prior to a disaster? The Philippines experience, on average, 20 tropical storms per year. Accurate up-to-date maps of facilities and infrastructure needed to recover from such emergencies post-disaster should be mapped in advance in OpenStreetMap as part of a preparedness program. I am interested in learning more about the types of facilities and infrastructure that need to be mapped in advance as part of a preparedness effort and see OpenStreetMap as a logical platform for presenting that information.

Interested in learning how to build your own digital maps using the tools that Bob learned? Enroll now in our 4-week digital mapping course, Mapping for International Development.

As Syria’s civil war draws close to its third anniversary, actionable data for foreign aid workers remains scarce. Although the conflict has seen the birth of civilian reporting agencies (warning, graphic content) which have uploaded more YouTube videos than CBS News, CNN, Fox News, ABC News and the Associated Press combined, basic questions about where humanitarian aid is most needed and which delivery routes are safest remain unanswered.

It was this lack of information that drew Caerus Associates to partner with First Mile Geo to research opinions about living conditions, safety, and resource access from residents in Aleppo, Syria. Formerly the source of 35% of Syria’s manufactured goods, Aleppo has become a major conduit for humanitarian aid crossing the border to Syria from Turkey. Working with teams based on the ground in Syria, Caerus Associates and First Mile Geo were able to obtain essential data from each of Aleppo’s 56 neighborhoods. The study represents the single most detailed project conducted on the Syrian conflict, showing time-series data with neighborhood-by-neighborhood results over a period of four months.

Field teams conducted bi-weekly data collections on the locations of roughly 180 security checkpoints, as well as the conditions of bakeries throughout the city. Field teams also collected data about political perceptions, service access, and the presence of key groups on a monthly basis. The result is a collection of highly detailed maps that show everything from the price of bread in a neighborhood to the presence of armed groups. Of course, maps and data need to be accompanied by analysis and context, which are provided in an accompanying report that shares just a few of the following key findings:

  1. The Islamic State of Iraq and Syria (ISIS), an Al-Qaeda affiliated group is taking over Aleppo. While ISIS was a marginal player, controlling only one neighborhood in September of 2013, it now controls 10 neighborhoods – more than any other than any other armed opposition group in Aleppo. ISIS’ reputation for kidnapping aid workers and disrupting humanitarian operations make the neighborhoods it occupies in the east of Aleppo particularly dangerous to access.

Screen Shot 2014-02-25 at 4.24.54 PM.png

  1. The Syrian Government may be actively restricting basic services to opposition-held neighborhoods in Aleppo. Residents who participated in surveys conducted with First Mile Geo reported an average of 6 hours per day of electricity in opposition-held neighborhoods, while those living in government-held areas reported an average of 12 hours per day. Additionally, more than 40% of bakeries – a key source of food in opposition-held Aleppo are closed compared to just 10% of bakeries in government-held areas. The study confirms what many in the humanitarian-aid communities have feared since the beginning of the conflict: the most inaccessible areas of Aleppo are also the ones most in need of humanitarian assistance.

formatted_screenshot.png

First Mile Geo worked with organizers on the ground in Aleppo to survey which bakeries (bread that bakeries produces is a staple food in Aleppo) were still functional.

  1. Lastly, there is little consensus among Aleppines regarding who is the legitimate representative of Syrians. While the just 12% of Syrians felt that the Assad regime was legitimate, less than 2% of the participants said that the Syrian opposition (the “Etilaf”) represented the Syrian people. The majority of Syrians felt that “No One” represented them. Most importantly, these opinions were held evenly across all neighborhoods and did not correlate with whether whether or not a resident lived in a government or opposition-held area. Without a strong mandate from the Syrian people, it’s unclear what (if any) influence is wielded by parties negotiating for peace in Geneva.

Beyond providing key insights about realities on the ground in Aleppo, this study also highlights the importance of geographically oriented information. Even within the geography of one city, the disparities between basic services and safety can vary dramatically between neighborhoods and even city blocks. As developing countries continue to urbanize at a rapid pace, geographic methods such as those used by First Mile Geo will continue to grow in importance for humanitarian organizations looking vulnerable populations.

Interested in digital mapping of Syria or other challenging contexts in international development? Sign up now for our upcoming Mapping for International Development online course which runs May 26 – June 20, 2014. Would you like to access First Mile Geo’s data for your own use? Read their blog post to learn more.

Remember when map making used to be simple? Neither do we, which is why we’re teaching a new course on Mapping for International Development. This increasingly complex intersection between open/closed data, online/offline tools, and practitioner communities all relevant to digital mapping could use a handy primer.

Last week, MapBox closed a $10 million Series A from Foundry Group as part of a move seen to rival Google Maps with an open-source mapping solution. While the results of this investment remain to be seen, there are echoes in this conversation from the intense debate last year around the World Bank’s initial decision to use Google Map Maker instead of OpenStreetMap, which raised concerns from organizations such as Global Integrity about why the bank would choose a closed data solution over an open one. Ultimately, the World Bank reversed its decision and went with OpenStreetMap, which provides simple, complete access to its database under an open license.

And it’s not just about the maps themselves, but what is being done with them. The Global Slavery Index by Walk Free chose to visualize slavery numbers by country. Team Rubicon partnered with Palantir to repurpose maps used to track IEDs to help rebuild homes needing repair after Hurricane Sandy. Democracy International and New Rights Group visualized voter data in Tunisia to present stakeholders with better information for the electoral process. And InterAction produced an NGO Aid Map to improve coordination of NGO activities.

Image from the Atlantic on Morningside Analytics visualization

Photo Credit: The Atlantic

But data visualization and mapping isn’t just restricted to geodata. Since information and individuals are only a click away online, work being done by Morningside Analytics to map the “cyber-social geography” of the internet — analyzing who is talking to whom and what they’re talking about — is just as valuable, if not more so.

So far, we’ve had a great response for the course on Mapping for International Development, which is nice to know we’re not alone in our enthusiasm. We’re excited to welcome participants so far from about a dozen countries including Australia, Cameroon, Canada, Ecuador, Jordan, Kosovo, Mexico, the Netherlands, the Philippines, USA, and UK. Participants in this course represent organizations such as the World Bank, UN Foundation, UNICEF Innovations Lab Kosovo, Gallup, InterAction, Telecentre Foundation, Canada Foundation for Innovation, Australian National University, IFES, School of Oriental and African Studies, Centre for Development Innovation, Generations for Peace Institute, ACT/JEVS Human Services, CIMM, Stability: International Journal of Conflict and Development, and many more.

There’s still time to join, so if you’re interested in registering for our four-week online class on Mapping for International Development, register here. We hope you’ll join us!