By Sairah Yusuf, TC141: Mapping for International Development (Fall 2013) alumna

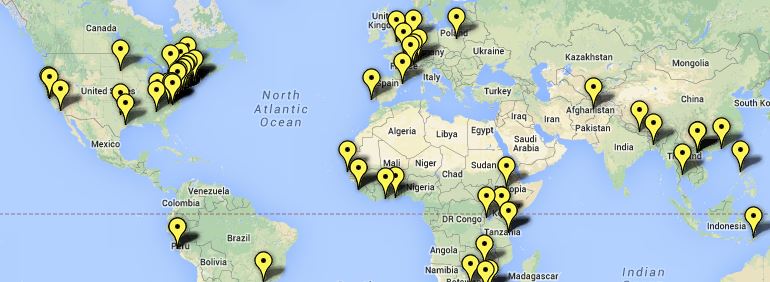
Before taking this Mapping for International Development course last fall, I had absolutely no previous background on mapping tools, so everything about digital mapping was new to me. For my course final mapping project, I created a digital map of the countries and locations of participants of an international training camp held by Generations For Peace (GFP) in November 2013 (Amman Camp 2013). Given my involvement in evaluating the impact of this training, I wanted a way to visualise the effectiveness of the training.

Here are the steps that I took for my introductory experience in creating a map for my work at Generations For Peace:

Step 1: Define the purpose of your map

Throughout the course, the importance of defining the purpose of your digital map as a first step emerged with debates regarding representation and privacy concerns. My aim with this map is to understand the cascading effect over time of these Generations For Peace volunteers, who will be passing on their skills to new volunteers in their home countries in the Middle East. By maintaining this map from November 2013 to November 2015, I hope that it will be possible to visually demonstrate the geographical impact of this training.

Step 2: Select your dataset

I used data from Amman Camp 2013, including the home country of each individual trained and the geographical reach of the training. I felt that this data was simple enough to work with, given that this was my first exposure to mapping. That said, I had to create the dataset from scratch, entering street addresses/locations for each participant.

Geocoding data in the MENA region proved to be the biggest challenge because geocodes for most street addresses (which were predominantly in Arabic) could not be found in the APIs I used. In addition, we had trainees from the occupied Palestinian territories at the GFP Camp. I struggled with pinpointing their locations on the map since the occupied Palestinian territories did not show up as a country option in many of the geocoding tools I tried. I had to get around this by tagging individuals from this region as hailing from Israel and then manually changing the name later to reflect their location. This issue was important to deal with because I did not want any of these trainees to view the map I had created and feel like I had misrepresented where they were from in any way due to geo-political sensitivities.

Step 3: Select your mapping tool or software

The Mapping course featured a variety of tools including Google Maps Engine, MapBox, Ushahidi, OpenStreetMap, CaerusGeo, and Palantir. I chose the Mapbox/TileMill combination over other options because I felt it allowed me to customise my map more – I could colour in different countries and introduce different levels of interactivity within the map.

Step 4: Choose your design

My design choices were partly shaped by wanting to keep my map easily readable, using block colours and simple labels, and also to keep my map customisation as simple as possible since this was my first mapping exercise. I also wanted the countries in question to stand out quite clearly.

By introducing dots in different colours for new individuals these volunteers train in their own countries, over the course of 2 years, for example, this would show how much of a geographical “spread” the training from Nov ’13 had. It would also help distinguish between volunteers with different levels of training. For example, as time goes on and individuals complete GFP programmes and further training, it is possible to change the colour of the dots representing those who were trained at the original Camp to red, demonstrating their status as a GFP “Pioneer.” Any new volunteers they train can be represented in “blue.” The idea is therefore to improve this map and maintain it over a period of time to represent these changes.

Filling out more details in the second click feature can provide relevant information about each individual – what they’ve done in the past and what programmes they are working on now, for Generations For Peace.

Takeaways:

Basic mapping software can actually be quite accessible, even with very little technical training. However, there’s definitely something of a “glass ceiling” in its use, after which more technical expertise is required. Overall, Mapping for International Development was a really great course, and I’ve already recommended it to others! This online course covers debates in the field in some depth, but also focuses on mapping tools in the field in enough detail to have a platform to build on afterwards.

Are you new to digital mapping as well? Would your work benefit from geographically visualising projects and impact? Register now for our online course on Mapping for International Development.

Last Thursday, TechChange was proud to participate in the TechGirls program by inviting two young women from the Middle East to shadow our team during a work day. While we’ve always been committed to tech capacity building in the Middle East, it had been almost two years since we conducted a series of trainings in the West Bank, and we couldn’t pass up a chance to invite future colleagues into our home and share our enthusiasm. According to the State Department, the TechGirls program:

“[P]rovides girls from the Middle East and North Africa with the knowledge and resources to pursue higher education and careers in technology. This program builds on the U.S. global commitment to advance the rights of women and girls around the world.”

Nagham joined us from Nablus, Palestine. She is 16 and started using the computer at the age of 5; and she would like to study IT or Science. Nagham expects to improve her programming and game design skills. Sondos is from Zarqa, Jordan. She is 16 years old and has taken classes in robotics, Visual Basic, Oracle, Invention, Photoshop and HTML and SQL programming. Sondos is especially interested in pursuing technological interests that will aid the field of medicine.

With that in mind, we set up a variety of hands-on workstations that included:

Hands-On Coding and Electronics: Combining Art, Problem-solving, and Circuitry

Screenshot of our office temperature as measured by Arduino sensor.

Python-powered office temperature website

Since both TechGirls were interested in both programming and hardware, we started off with our in-house code ninja, Michael Holachek. Michael is 18, an avid robotics enthusiast, and will be attending MIT in the Fall to study Electrical Engineering. Michael started off with a short discussion about the connection between art and electronics (including a TED talk on painting circuits), introduced some basic programming in C and Python, and then demoed a few cool circuits on the Arduino and Raspberry Pi. They then worked together to make a TechChange mood lamp that played the TechChange theme song and display the office temperature on a website. At the end of the session, Sondos and Nagham came up with several ideas for applying these new skills to new problems, including attaching a room thermometer to an Arduino board to trigger an alert if the room became too hot for a baby.

Making Graphic Elements: Generating and Animating TechGirls Avatars

With their new Arduino boards built, both Nagham and Sondos sat down with Pablo Leon and Rachel Roth to try illustrating themselves and then animating their avatars in After Effects. Rachel provided a sketch of our guests and then we loaded them on our custom tablets for illustration. Trying their hands with our stylus, they learned about creating layers, sorting into folders, using filters, etc.

Illustrated avatars of TechGirls

New avatars illustrated by TechGirls!

After they finished creating avatars, Alon Askarov demonstrated how to use the Puppet tool to teach them how create short animations. Given that we were limited by time and that TechChange animations take time (see our blog post on this), these were kept to minimal facial expressions, but we still had fun doing it!

A brief animated loop of Sondos

Animated Sondos

Designing a Four-Week Course: A Tour of mHealth

Since Sondos was interested in public health projects, we tried to show off what we’d been working on for our mHealth and maternal health initiatives. We opened up the most recent course that we had built with the UN Foundation on Mobile Phones for Public Health,but rather than the speakers or content, what seemed to be the most interesting was the 161 participants in the course from all around the world. We agree: It is pretty cool.

Student map from our mHealth class

Student map from our mHealth class

But on top of the novelty, we also chatted about how we believed connecting these students was a core part of online learning — not just transferring knowledge on technology, but building a community of practice. After all, technology is the easy part when it comes to mHealth.

Building Interactive Learning Experiences in Articulate

TechGirls Articulate screenshot

But a platform isn’t enough for online learning. Catherine Shen discussed how to structure content for educational purposes. This meant walking through the current courses being designed for State Department, USAID, and the World Bank. Catherine used a current course from OTI Lebanon on advocacy for the TechGirls to see the mechanics of course design at work.

The TechGirls then created a short interactive presentation on their TechChange day, integrating their animated avatar with a survey that the girls used to tell us about their experience. Using a Likert scale, the girls gave their impressions of their shadow day.

The results were clear: Both of our participants strongly agreed that the job shadow day was fun and inspiring, in addition to being informative and interactive.

It was for us as well. Thanks to the TechGirls team for joining us!

Funny group picture of TechChange and TechGirls

Thanks TechGirls!

This post was written with contributions from the entire TechChange team. Thanks specifically to Catherine Shen and Michael Holachek for contributions in the sections above.

The first step to closing the ever-widening technology gender gap is getting more young girls excited about technology. This is the goal of the State Department-led TechGirls international exchange program, which connects young girls from the Middle East and North Africa with tech mentors in the US. The three-week program aims to connect and support the next generation of women in tech by providing them with a foundation of skills, experience, and networks that can lead to future career opportunities in technology back in their home communities.

It is no secret that our team is passionate about ensuring global inclusion & understanding of tech applications, so you can imagine that we are incredibly excited to be a part of this years’ TechGirls program. On July 11, we will be hosting two budding female technologists, one from Jordan and the other from Palestine. These young women will get a behind-the-scenes look at our DC nerd attic, shadowing different members of the TechChange team.

This will include spending time with our in-house coding ninja Michael, learning the basics of Raspberry Pi and the “Internet of Things.” At another station, they will meet with our learning experience designer Catherine to get an inside perspective on the life cycle of a TechChange course, from design to reality. Our animation team will lead them through the basics of creating compelling and educational graphics – perhaps even letting them design their own.

Announced in 2011, the TechGirls programs was built on the heels of the first-ever TechWomen mentoring program, which pairs emerging female leaders with top American women in the technology sector. This year’s TechGirls cohort is comprised of 27 girls from eight Middle Eastern countries and the Palestinian Territories, who will gain hands-on skills development in fields such as programming, robotics, mobile app building, web design and video graphics.


Qatar-based Al Jazeera may be completely responsible for the lack of productivity amongst university students, in many different disciplines, all over the world. Walking through the halls of a local university you may hear, at any one point, one student saying to another “Al Jazeera ate my homework.”

The reason for this is what the LA Times has coined Al Jazeera’s ‘CNN moment’ (referring to the network’s coverage of the Gulf War, which catapulted it into popularity). Al Jazeera’s around the clock news and live updated coverage of the protests and revolutions throughout the Middle East and Africa, has in many ways changed the rules of the media game. Al Jazeera has led news media outlets down a path that forces all others to be very conscientious of not only what they report but also in keeping up with real-time events. (more…)

U.S Secretary of State Hillary Rodham Clinton – speaking on behalf of the Obama administration – expressed views on the power of media via a statement on 21st Century Statecraft:
“… We have seen the possibilities of what can happen when ordinary citizens are empowered by Twitter and Facebook to organize political movements, or simply exchange ideas and information… we have the potential to engage in these new and innovative forms of diplomacy and to also use them to help individuals be empowered for their own development…”
And engaging is indeed what the administration is doing. (more…)

The BlackBerry smartphone, launched in 1999 by Research In Motion (RIM), is the quintessential, on-the-go tool for communicating. In 2004 BlackBerry had over two million subscribers worldwide, one of the key selling points has been the unique ability to use the free Blackberry Messenger service (BBM) to communicate with fellow Blackberry users. Now however that usage has been banned in the United Arab Emirates (UAE) because it bypasses their ability to monitor communications.

(more…)