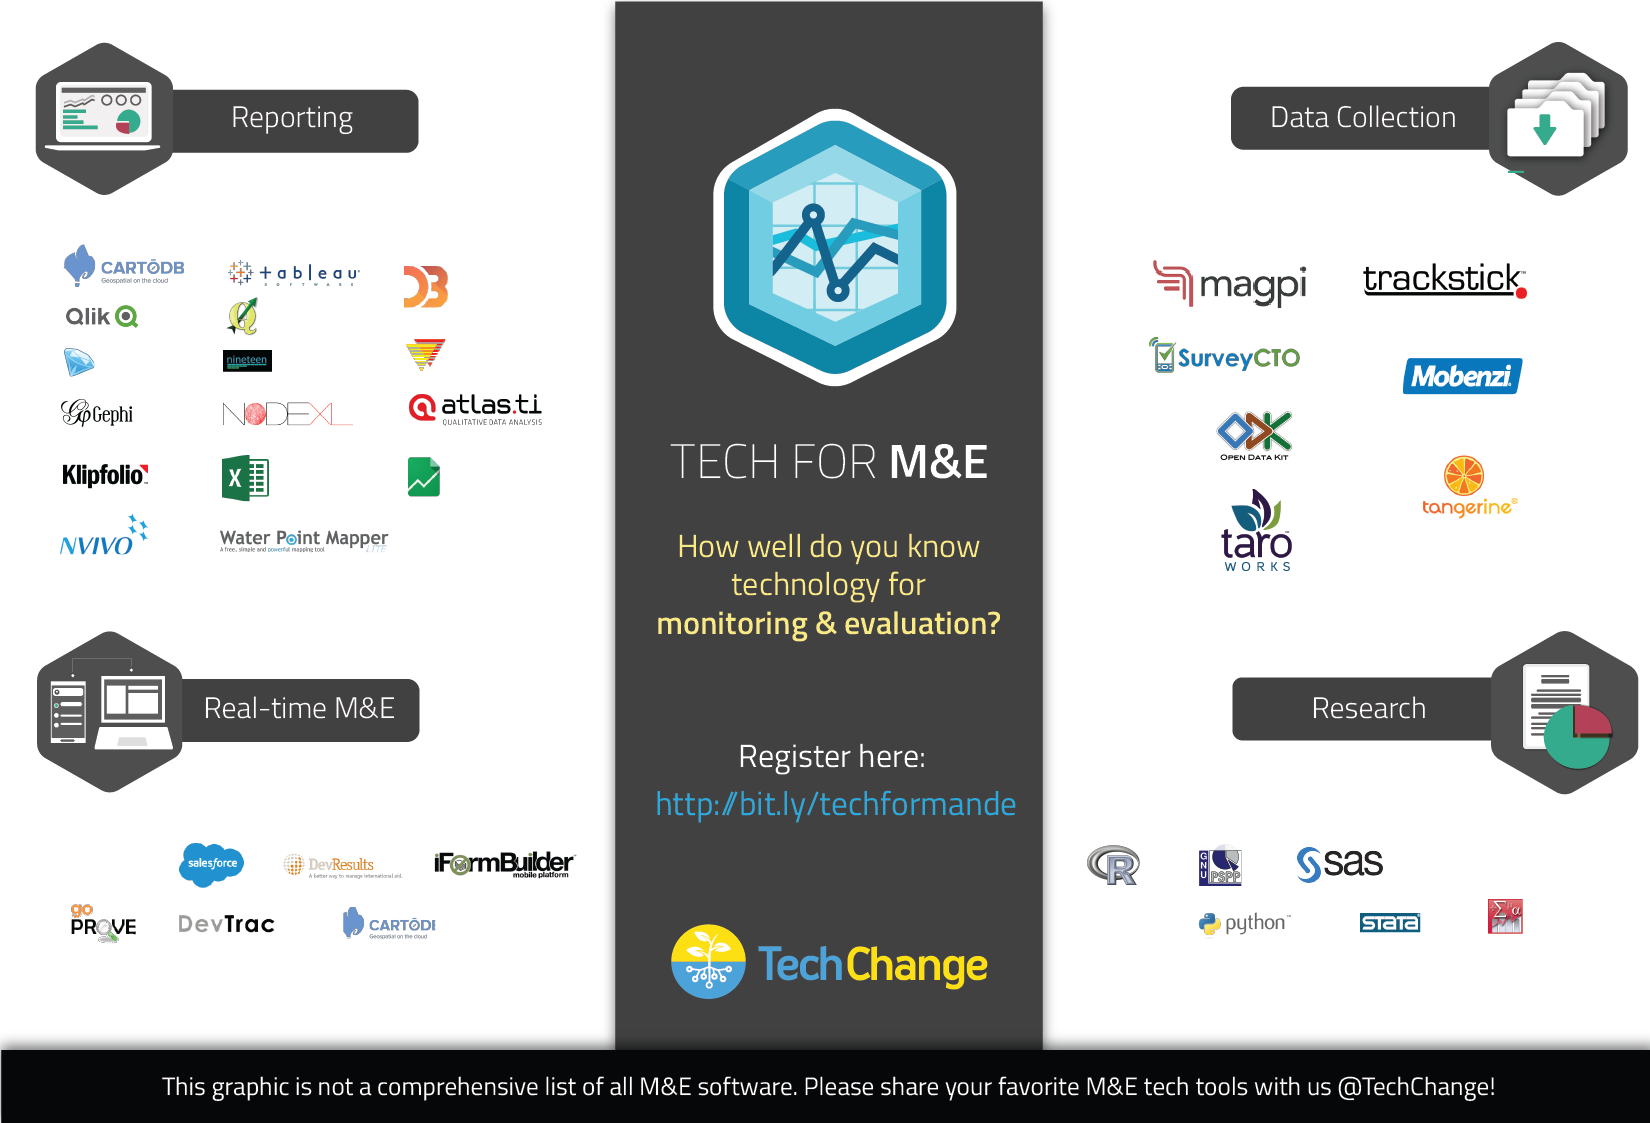
With the rapidly growing field of monitoring and evaluation, there are many technology tools that are designed to help the many roles of M&E practitioners. The fastest growing area has been digital data collection, which currently uses mobile phones and portable GPS systems. Reporting has become easier with all the tools for data visualizations and data cleaning. There are also many research options with statistical software and programming languages for data entry, documentation, and analysis. In addition, real-time M&E tools let you do program and data management with real-time project updates. What we found in the course was that there are tech tools that integrate multiple aspects of M&E.

Here are several of the tools we discussed in the inaugural round of our Technology for M&E online class last fall, as crowdsourced by over 100 IT experts and M&E practitioners based in over 30 countries. In the next iteration of this course, we’ll be covering some of the latest tools including satellite imaging, remote sensors, and more.

What M&E technology tools do you use? How has your experience been with these tools listed? Are there great tech tools for M&E that we missed? Please share with us in the comments or tweet us @TechChange.

Interested in learning about these tools more in depth? Join us for our popular Tech for M&E online course that runs 14 September – 9 October.

On September 25 and 26, over 200 development practitioners and technologists filled FHI 360’s conference rooms and hallways in Washington D.C. to discuss the intersection between technology and monitoring and evaluation (M&E). Some of the conference attendees included participants and guest experts in TechChange’s ongoing online course on Tech for M&E and it was great meeting so many these online course participants in person and offline.

Supported by the Rockefeller Foundation, GSMA, and FHI 360, the M&E Tech Conference was a two-day conference held in D.C. (followed by another one event in New York) to discuss the emerging role of technology in M&E and its implications to everyone involved in the international development industry. The release of the discussion paper, Emerging Opportunities: Monitoring and Evaluation in a Tech-Enabled World kicked off the first panel, followed by two days of great panel discussions and engaging break-out sessions. The event also featured a panel facilitated by TechChange online course facilitatorKendra Keith on “What’s Next in Visualizing Data for Better Decision Making?” and a lightning talk on ‘How to Use APIs for Real-Time M&E’ that I presented.

In case you didn’t make it to the D.C. M&E Tech conference, here are a few key takeaways from the event.

1. Technology is not a substitute for good M&E methodologies

One of the panelists perfectly summed up the current state of technology in M&E from a technology perspective: it is not always clear why the M [monitoring] is associated with the E [evaluation]. While technology has made data collection and reporting easy, making sense of the data and how it affects programming still requires newer tools and M&E methodologies.

Good M&E requires capturing and analyzing both quantitative and qualitative data. While there are emerging M&E tools (e.g., SenseMaker) and techniques (e.g., natural language processing), cost and expertise continue to make capturing and analyzing qualitative data difficult. As mixed methods–using both qualitative and quantitative data — are discussed more in an M&E setting, practitioners still have a great deal of work to do.

Kerry Bruce speaks at the first panel

Kenneth M. Chomitz, Kerry Bruce (a guest speaker for TechChange’s Tech for M&E course), and Maliha Khan discuss the current state of Tech for M&E

Mobile phones have been a hot topic in development, but one of the lightning talks revealed a surprising fact: Mobile surveys are not as effective as we think they are. The average response rate for surveys conducted in-person was 77% compared to 1% for mobile phone surveys. While the comparison may not be fair, it is worth noting that the introduction of any technology also requires M&E.

2. Technology introduces new data issues to M&E regarding responsibility, security, and selectivity biases

During the first panel, one of the panelists mentioned that the next “scandal” in development will be about revealing sensitive data. While not a new topic in development, data responsibility becomes increasingly important with the introduction of technology. Unfortunately, data security was primarily relegated as a panel (Whose Data? Whose Privacy?) and a shout out as one of the 9 Principles for Digital Development. This panel also marked the release of the Responsible Development Data Guide, a resource I co-authored, that focuses on protecting digital data and beneficiary privacy in international development.

Linda Raftree and Michael Bamberger lead a break-out session

Linda Raftree (a regular TechChange guest expert) and Michael Bamberger lead a break-out session discussing the emerging opportunities and challenges of using ICTs for M&E

Another common problem that arises with introducing technology to M&E is selectivity bias. Digital surveys tend to be limited to digitally literate populations with access to technology. Yet, even digital literacy and access to technology doesn’t guarantee a truthful response. For example, the panel on data privacy shared that women often didn’t respond truthfully to mobile surveys because their husbands or family members often monitored their personal phones.

Technology also biases researchers and evaluators towards quantitative methods and data. Qualitative data collection, analysis, and visualization software has not kept pace with tools for quantitative data.

3. Data matters more than ever in development

Recognizing the challenges and opportunities technology brings to M&E, the event included many conversations on data. There were break-out sessions on topics like data visualization, leveraging big data, how mobile phones can help in M&E, data security issues, and more.

Data visualization

The data visualization panel showed that there are a lot of new techniques to visualize data. Network visualization is a fantastic way to view a system (e.g., an organization or a program). It’s a simpler way to see where multiple links connect and understand where they need to be strengthened. Mapping allows for easier analysis of aid efficacy. Development Gateway presented their Aid Management Platform with its mapping feature that is aimed at governments in countries with development programs. In particular, they highlighted the success in Malawi and their public facing site with an interactive map. Excel–the tool that most people have and use to create pie charts–can be used to create some outstanding visualizations.
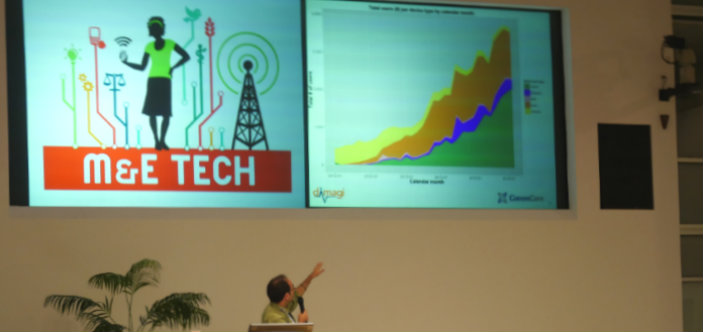
Neal Lesh of Dimagi presents at a Lightning Talk

Neal Lesh of Dimagi presents trends in mHealth systems from over 175 CommCare projects

Open data

Most importantly, we are all looking forward to the day when open data is the standard. Many organizations spend a lot of time and money collecting the same data. If open data was the standard, available data can be used as baselines and potentially show impact after a project. Open data can also push for data structure standards (e.g., IATI) and allow data to be decentralized with application programming interfaces (APIs) connecting the data sources.

The challenges technology introduces to monitoring and evaluation, like data security and access, are topics we are also currently discussing in our Tech for M&E online course with a class of 100 students from all over the world. Due to popular demand, we are offering the next Tech for M&E course in January 2015.  If you are interested in joining the discussion, apply before November 1 to get $100 off the full price of the course during this early bird discount period for the next Tech for M&E course.

If you did attend the event, what did you take away from the conference? Did you attend the conference in New York? Share some of your highlights and insights!

This piece has been crossposted from Health Unbound. If you’re interested in learning more, please visit our course page on mHealth: Mobile Phones for Public Health.

On November 14th the Mobile Phones for Global Health Online Certificate course officially kicks off and as we head into the final countdown we are offering a special preview of what participants can expect from the four-week course!

With 75 feedback surveys completed (thank you to all those who participated) we identified some of the most well-known thought leaders in the field speaking throughout the course.  Students will have the opportunity to engage directly with leading applications developers, and learn from practitioners who have had significant experience in implementing mobile phone based communication systems around the globe. The agenda will include:

Weekly Course Topics:

  • Week 1: Introduction to Mobile Health
  • Week 2: Strengthening health systems
  • Week 3: Moving towards citizen-centered health
  • Week 4: Technology Standards & Interoperability and Learning from other mServices

Featured Speakers:
Patty Mechael, Executive Director of the mHealth Alliance will provide students with an engaging introduction to the field, discussing the evolution of mobile phones for international health, and how these technologies are being used to today to respond to some of the greatest global health challenges.

Kicking off week 2, Joel Selanikio, co-founder of DataDyne, will present on the development of Episurveyor, and how mobile phones are being used to collect, manage, and sort data.

Also in week two, the class will be joined by Isaac Holeman, Chief Strategist for Medic Mobile, who will engage with students on the range of open source applications in the Medic Mobile toolkit – including the well-known Frontline SMS system that allows computers to send messages to large groups of people at a low cost.

A number of other guest speakers and presenters will also be featured. Stay tuned as we get closer by checking the course landing page.

In addition to these guest speakers, participants will engage with case studies, multimedia tutorials, interactive exercises, and live demonstrations of such tools as interactive voice recognition (IVR),  SMS (text message) communication programs, smartphone applications, and health information systems for data collection and management. Through this combination of hands-on experience, and engagement with practitioners on the ground, the goal is to provide students with an in-depth introduction to the field of mHealth.

Participate in the Live Twitter Chat and YOU Could Win 2 Free Passes!

Leading up the course, the mHealth Alliance and TechChange will provide an opportinity to for individuals to win a free pass to enroll in the course! Together TechChange and the mHealth Alliance will host a live-Twitter chat from @techchange and @mHealthAlliance using #tc309 on Friday, October 26 at 1pm EDT.

During the chat we will engage all participants in a variety of discussion topic and questions related to mHealth. We’re eager to hear from you about questions that you may have on latest innovations and projects in the field. All participants in the twitter chat will be included in a drawing to win a free seat in our upcoming course: mHealth Mobile Phones for Public Health. We will give a away a total of 2 seats. More details to come but tweet at @techchange or @mHealthAlliance if you have questions, and we look forward to having you join us there!

This has been reposted from the DataDyne blog. If you’re interested in learning more about this topic and Magpi, check out our upcoming course with the mHealth Alliance on Mobile Phones for Public Health. Class starts on June 3!

More features, more speed, more ease of use, same prices!

In January 2013, DataDyne will unveil a completely new version of EpiSurveyor — including a new name! Yes, we’re retiring the venerable “EpiSurveyor” — with 10,000 users in 170 countries easily the most widely used mobile data collection system in the development sector, and the most successful ICT4D (ICT for development) project ever — and replacing it with “Magpi”.

We chose Magpi (rhymes with “sky”) because we realized that a lot of people thought a product named “EpiSurveyor” could only be used for epidemiological surveys.

That’s understandable, but we want to make sure people know that EpiSurveyor is being used to collect all kinds of data: in health, agriculture, supply chain, consumer surveys, and more. So we’re losing the name.

More Than 40 New Features!

Our Nairobi development team has added more than forty new features, more speed, more ease of use — and all the same pricing, including the free version. Magpi is a completely new application, written from scratch, that works like EpiSurveyor (so you’ll have no trouble using it if you’re used to EpiSurveyor).

Mapgi’s beta testing is ongoing, and the 1.0 release will be in January 2013. Note: there will be NO interruption in service when we make the switch. Sign up for our mailing list to make sure you are notified when Magpi goes live! (if you’re an EpiSurveyor user, you’re already on the list).

Watch Magpi in Action!

And in the meantime, you can watch this video (made with the help of our friends at TechChange) of DataDyne CEO and co-founder Joel Selanikio demoing both EpiSurveyor and some of the big improvements in Magpi. The Magpi section starts at about the 3:25 minutes mark:

You land in a country that is recovering from a long war.  The infrastructure is limited, but there is a nascent democratic government.  To make up for the lack of infrastructure, citizens use text messages sent to a central receiver or Twitter feeds to let government officials know what they need.  I’m describing E-Democracy, and using a platform like Swiftriver, these text messages and Tweets can be organized by time and geographic location.  It provides information to elected leaders, while starting a public record of citizen-government interaction. Since the Swift platform can handle data streams ranging from RSS feeds to the inflow of discrete numeric data, it’s an excellent platform for governance and peacekeeping professionals to use in their field work.   (more…)

Much of the event data that new technology is making available to practitioners contains geographic information, and to take advantage of this we need a way of thinking about geographic information in a predictive way.  Combining today’s post with last week’s “Corralling the Data instead of the Data Corralling Us” post, we get a data filtering methodology that gives us data that is timely and geographically relevant in the field.  This will set us up for next week’s post, which will explore how to use time and space filters to maximize the value of software like Swiftriver which significantly speeds the process of data collection and management for project leaders and analysts.

(more…)