Putting Global Crises on the Map Using Social Media Data and ArcGIS
|
How can mapping the geolocations of tweets tell a story about global atrocities? How can digital mapping be integrated as a learning tool for university classes?
As part of his final project for TechChange’s online course, TC141: Mapping for International Development in Spring of 2014, GIS professor Tom Mueller wanted his students to explore these topics. In Professor Mueller’s course, “Introduction to Geography” at the California University of Pennsylvania in Pittsburgh, he had his students look for patterns in social media during humanitarian crises such as Ebola outbreaks and conflict casualties, and visually display the spatiality of those events.
Throughout the semester, Tom held several discussions with his students on various topics using social media to map out crises. In his course’s final assignment, Tom had about 100 students in the geography class work in groups to map various Sudan/South Sudan incidents by following several Twitter handles and categorized tweets. After examining their papers, he decided to ask them to choose a country and possibly use CrisisNet as several students became more concerned about gathering tweets rather than the information itself. He felt students would take more ownership of their projects if they independently selected their country, region or topic of choice. So, he is having them search topics on CrisisNet to understand the information that can be part of a tweet. Subsequently, they will examine some news sources and choose a country, topics, etc.
We sat down with Tom Mueller to learn more about incorporating digital mapping into his university class.
1. What is your background in mapping? What interested you in taking TechChange’s Mapping for International Development class?
I have been a GIS professor at a small school just southeast of Pittsburgh called California University of Pennsylvania. I read about crisis mapping and wanted to learn more. When I read about TechChange’s Mapping for International Development online course, it seemed like a great way to acquire more knowledge.
2. What were the most useful tools that you became familiar with in Mapping for International Development online course? How are you applying what you’ve learned in the class?
The two most important tools I found to be useful were MapBox and CrisisNet. While I encouraged my students to use ArcGIS Online in my course, learning about MapBox and its use cases helped me see the connection. It made me realize that this type of project could work with an introductory class with no GIS experience since all we needed was
latitude and longitude of the location. This may sound silly, but after going through it on MapBox, I thought I can do this in ArcGIS Online.
Now I know I should have realized it before but going through the process let me step back and understand the power this project might have on the students.
Hopefully, they understand the power of location, social media, etc.
The most important aspect of the Mapping for International Development course was the feedback from the global class participants and TechChange instructors. It was their discussions that helped me design the project guidelines to let students follow certain Twitter accounts to gather information and attempt to investigate locations based on those tweets.
All the topics we discussed in the TechChange online course helped me to understand the beginnings of this type of geographical analysis and build my ideas. As I started formulating my ideas, I could put this information on the discussion board and the TechChange course participants would give me their comments, and suggestions or ask questions. All this information allowed me to build my university class project from the ground up for my own students.
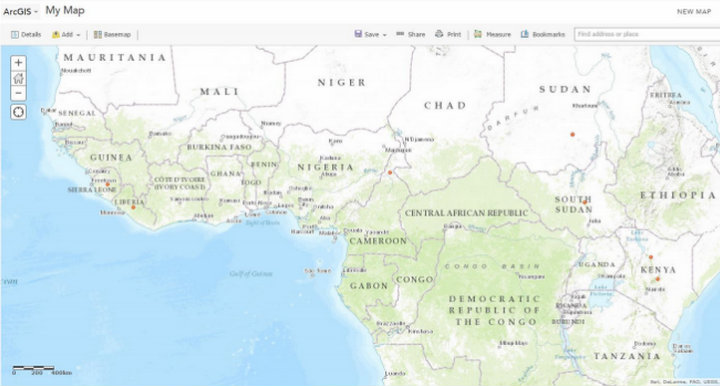
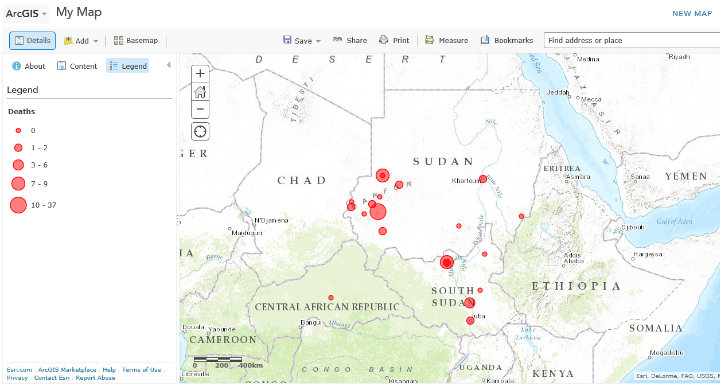
An ArcGIS map produced by one of Tom Mueller’s students indicating the locations of early Ebola incidents.
3. What inspired you to create this digital mapping exercise for your university students?
In my “Introduction to Geography” class at California University of Pennsylvania in Pittsburgh, my students and I examine geography through a global and regional lens. Sometimes geography might not be the most attractive topic for students, so I needed a hook to pique their interest. Humanitarian issues and genocide seemed to catch the students attention the most. I also knew that the situation in Sudan / South Sudan was active and the students would be able to get a lot more current information from Twitter than other sources.
4. How did your students respond to the digital mapping exercise? What were the results?
My students really enjoyed the assignment as it allowed them to learn about an unfamiliar part (at least to them) of the world. A few students said they could not believe the issues in this area since it did not seem that the popular media was covering the events. If I include a digital mapping exercise again in future classes I teach, my only change would be to may let them choose a developing country and use CrisisNet as their data source. Then they would present their findings to the rest of the class.
5. What is your advice for other professors looking to incorporate digital mapping/blended learning (offline +online) into the courses they offer at universities?
Professors need to be flexible when experimenting with new technology tools in the classroom. For this project, we changed our plans slightly about three times based on conversations with the students and events around the world. The key for my class was not to write a “thesis”; it was for students to understand the power of social media during crises and the spatiality of those events.
About Thomas Mueller
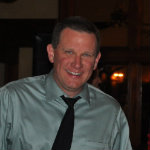
Dr. Thomas R. Mueller is a professor at the Department of Earth Sciences at the California University of Pennsylvania and an alumnus of TechChange’s Mapping for International Development online course. His research agenda has grown dramatically throughout his career at California University of Pennsylvania. He applies spatial theory to the real world, particularly using Geographic Information Systems. His key to building a successful research agenda is to produce work through a variety of scholarly endeavors, including conference presentations, grants, technical reports, book reviews and publications in professional journals. He also has taught numerous GIS workshops for members of the local community, professors at Cal U and other campuses, and for the K-12 community.
Interested in learning different digital mapping tools for the context of humanitarian crises around the world? Enroll now in our upcoming Mapping for International Development online course.
Moved by images of buildings crumbling like sand castles and children wandering the streets crying for parents buried in the...
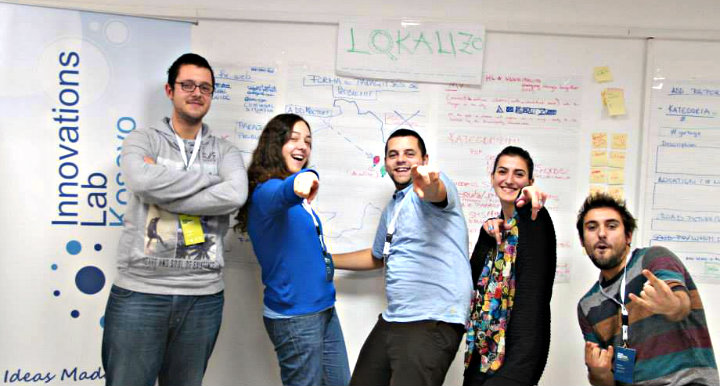
At TechChange, we are always excited to support the work of young social entrepreneurs across the world from Pakistan, Tunisia,...
By Michael Baldassaro, Innovation Director at Democracy International On Sunday October 26, 2014, more than three million Tunisian voters cast...